Americans are really smart. Some are just smarter than others.
And today, we will focus on the other Americans, the dumb ones. More precisely, what cities in the U.S. are the dumbest.
How do you decide which city in the U.S. is the dumbest? We used Saturday Night Science to measure the high school graduation rate and the rates of college completion for adults by city. We used those criteria to create an index and then ranked the cities based on the index.
And if you’re lost now, chances are you live in one of the 326 locations we analyzed.

Data | Crime | Cost of living | Movers
Data | Crime | Cost of living | Movers | Compare
El Monte is just a bit east of Los Angeles. Here, 47% of the residents are high school dropouts. There are 10 bars for every library here. In fact, there aren’t very many libraries at all in El Monte.
We’re not saying that a lack of libraries is a sign that people are stupid. We get it: Lots of people don’t attend libraries, and you can learn anything you want on the web. That’s if you have the web. There are large percentages of every large city that don’t have a computer or internet, and rely on a library in which to learn.
And that would be really tough in El Monte.
Data | Crime | Cost of living | Movers
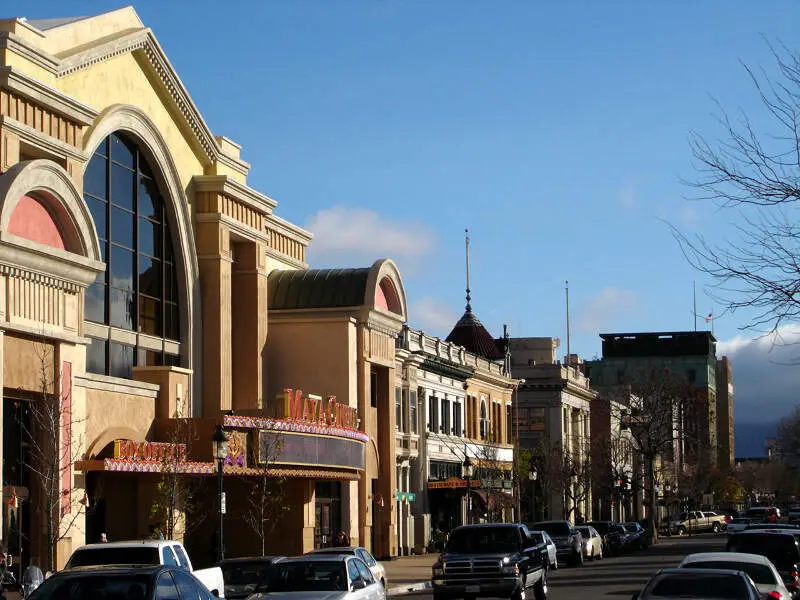
So here’s the deal with Salinas: It has one of the nation’s highest number of uneducated residents. That’s a fact. But the library to bar ratio is actually respectable. There are quite a few libraries in town here.
For that reason, we’re arguing that there’s no excuse that such a large percentage of the population remains uneducated. Like quite a few other cities on this list, Salinas is a huge agricultural town, and it has one of the largest concentrations of illegal immigrants in the nation.
Data | Crime | Cost of living | Movers
Data | Crime | Cost of living | Movers
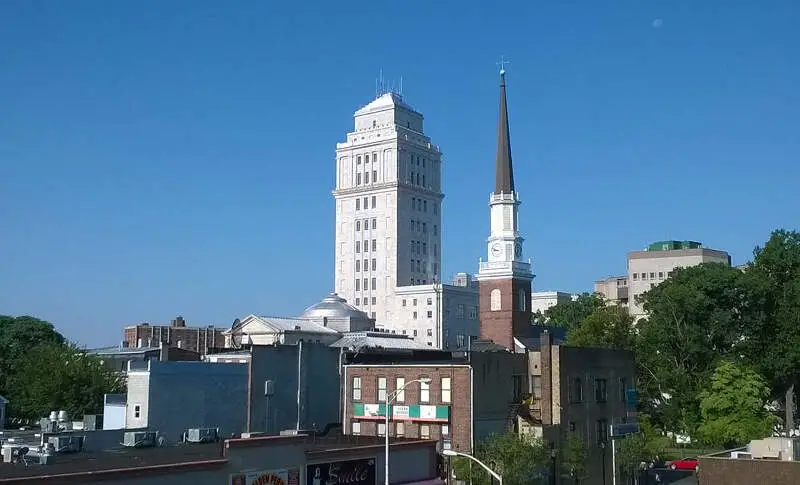
New Jersey isn’t known for its geniuses. Think of the Garden State and you conjure images of the Jersey Shore or the Sopranos. With that in mind, it’s not surprising that a couple New Jersey cities make this particular list.
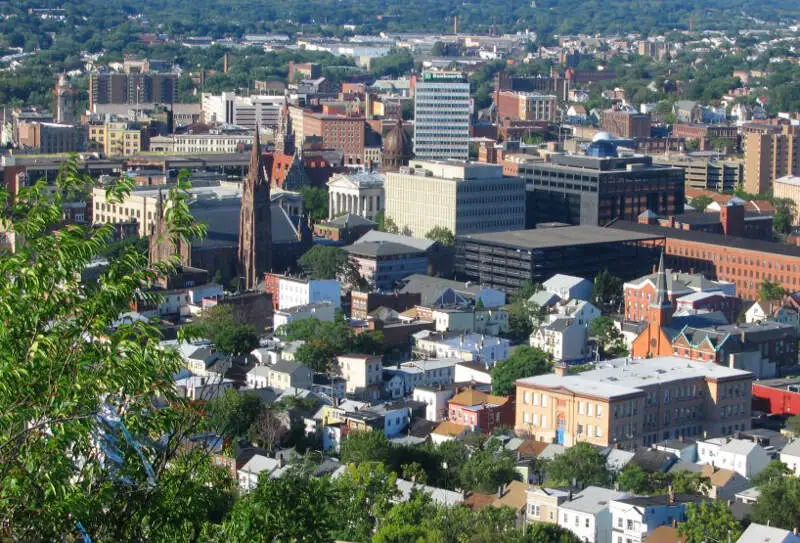
The second Jersey entry comes from Elizabeth, a town of 137302 residents located just south of Newark. In fact, part of the Newark airport is located in Elizabeth…all those fumes probably don’t help.
Data | Crime | Cost of living | Movers
Data | Crime | Cost of living | Movers
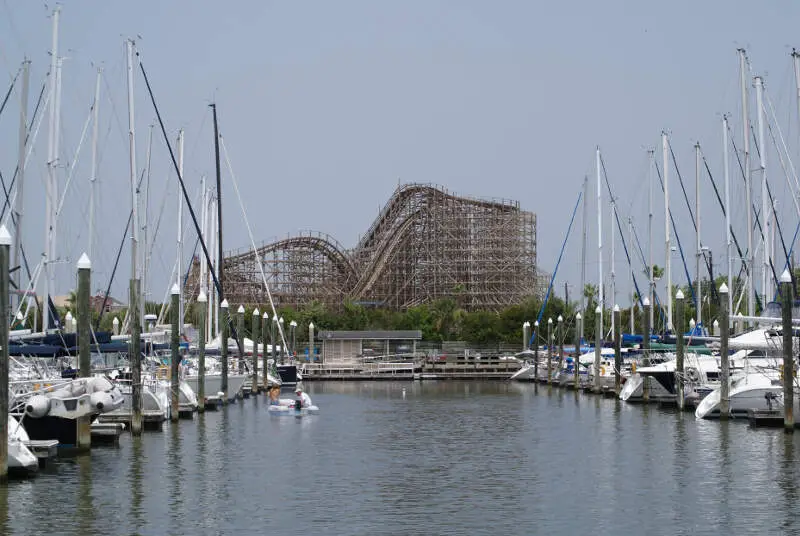
When your city’s nickname is “Pasa-get-down-dena”, that’s a clear indication that people are partying a lot more than learning. And more than a third of people seem to want to keep it that way.
A big part of the economy here is gas and oil exploration. Which is a great career for a hard-working, blue-collar worker that makes up a majority of the people living here.
Data | Crime | Cost of living | Movers | Compare
Data | Crime | Cost of living | Movers
When you have 22 bars for every library, and half of the people in your city are walking around without a high school education, that’s a sign that your town is lacking some real intelligence.
While we’re not judging the individual intelligence level of anyone in Santa Ana in particular, it’s clear there’s not a lot upstairs with many, many people here.
Santa Ana is centrally located in Orange County, and it’s considered one of the most densely populated cities in the country.
Data | Crime | Cost of living | Movers | Compare
The receipts
Compare the top ten
Pick a metric. The bars rescale. The red line is the United States’s statewide median.
On the map
Where the dumbest cities in America are
Saturday Night Science
Methodology: What stupid criteria did we use?
In order to rank the dumbest cities in the USA of A, we used Saturday Night Science to find the least educated cities.
We started by making a list of every place in the U.S. with over 100,000 people based on the 2020-2024 American Community Survey. That left us with 326 places to rank.
We then looked at the following dumb-tastic criteria for each of the places on the list:
We updated this article for 2026. This is our eleventh time ranking the dumbest cities to live in America. This article is an opinion based on facts and is meant as infotainment — don’t freak out.
- % of the city’s population with less than a high school education (Age 25+)
- % of city’s population without a college degree (Age 25+)
The full list
The Dumbest Cities In America For 2026
Click any column to sort. Search by city name.
| Rank | City | Population | Adult High School Dropout | Adult Highly Educated |
|---|---|---|---|---|
| 1 | Santa Maria, CA | 110,462 | 38.0% | 15.0% |
| 2 | Paterson, NJ | 158,735 | 26.0% | 11.0% |
| 3 | El Monte, CA | 106,109 | 36.0% | 15.0% |
| 4 | Salinas, CA | 161,761 | 38.0% | 16.0% |
| 5 | Rialto, CA | 104,143 | 25.0% | 12.0% |
| 6 | Elizabeth, NJ | 137,302 | 26.0% | 14.0% |
| 7 | Hesperia, CA | 100,775 | 24.0% | 11.0% |
| 8 | Pasadena, TX | 149,433 | 27.0% | 16.0% |
| 9 | Jurupa Valley, CA | 107,011 | 26.0% | 15.0% |
| 10 | Santa Ana, CA | 312,534 | 33.0% | 18.0% |
| 11 | San Bernardino, CA | 222,724 | 25.0% | 13.0% |
| 12 | Oxnard, CA | 200,928 | 31.0% | 19.0% |
| 13 | New Bedford, MA | 100,998 | 23.0% | 17.0% |
| 14 | Palmdale, CA | 164,634 | 23.0% | 17.0% |
| 15 | Hartford, CT | 121,127 | 25.0% | 19.0% |
| 16 | West Valley City, UT | 138,437 | 20.0% | 15.0% |
| 17 | Victorville, CA | 137,627 | 20.0% | 13.0% |
| 18 | Pomona, CA | 147,943 | 25.0% | 21.0% |
| 19 | Stockton, CA | 322,326 | 22.0% | 20.0% |
| 20 | Laredo, TX | 257,619 | 27.0% | 23.0% |
| 21 | Springfield, MA | 154,749 | 21.0% | 20.0% |
| 22 | Newark, NJ | 310,178 | 21.0% | 20.0% |
| 23 | Waterbury, CT | 114,869 | 19.0% | 17.0% |
| 24 | Brownsville, TX | 189,177 | 29.0% | 24.0% |
| 25 | Hialeah, FL | 226,165 | 23.0% | 23.0% |
| 26 | Mesquite, TX | 149,299 | 19.0% | 19.0% |
| 27 | Moreno Valley, CA | 211,666 | 19.0% | 19.0% |
| 28 | Fontana, CA | 214,169 | 20.0% | 21.0% |
| 29 | Allentown, PA | 125,976 | 19.0% | 19.0% |
| 30 | Ontario, CA | 180,547 | 22.0% | 23.0% |
| 31 | Kansas City, KS | 155,135 | 19.0% | 21.0% |
| 32 | Odessa, TX | 115,322 | 18.0% | 19.0% |
| 33 | Lynn, MA | 101,709 | 22.0% | 24.0% |
| 34 | Bridgeport, CT | 149,153 | 22.0% | 24.0% |
| 35 | North Las Vegas, NV | 278,595 | 17.0% | 19.0% |
| 36 | Garden Grove, CA | 170,964 | 25.0% | 26.0% |
| 37 | Brockton, MA | 105,386 | 19.0% | 22.0% |
| 38 | Inglewood, CA | 104,569 | 22.0% | 25.0% |
| 39 | Lancaster, CA | 169,169 | 17.0% | 21.0% |
| 40 | Detroit, MI | 638,530 | 16.0% | 19.0% |
| 41 | Yuma, AZ | 100,139 | 16.0% | 20.0% |
| 42 | Miami Gardens, FL | 113,177 | 15.0% | 19.0% |
| 43 | Garland, TX | 246,844 | 20.0% | 26.0% |
| 44 | Bakersfield, CA | 411,986 | 18.0% | 24.0% |
| 45 | Downey, CA | 110,939 | 19.0% | 26.0% |
| 46 | Modesto, CA | 219,215 | 16.0% | 22.0% |
| 47 | Cleveland, OH | 366,097 | 16.0% | 22.0% |
| 48 | El Cajon, CA | 104,449 | 16.0% | 23.0% |
| 49 | Fresno, CA | 545,970 | 19.0% | 26.0% |
| 50 | Elgin, IL | 114,934 | 19.0% | 27.0% |
| 51 | Anaheim, CA | 344,521 | 23.0% | 29.0% |
| 52 | Glendale, AZ | 252,833 | 16.0% | 24.0% |
| 53 | Edinburg, TX | 104,550 | 19.0% | 28.0% |
| 54 | Warren, MI | 137,928 | 14.0% | 21.0% |
| 55 | Riverside, CA | 319,069 | 16.0% | 26.0% |
| 56 | Corpus Christi, TX | 317,419 | 15.0% | 24.0% |
| 57 | Rockford, IL | 147,521 | 15.0% | 24.0% |
| 58 | El Paso, TX | 680,130 | 18.0% | 28.0% |
| 59 | Escondido, CA | 149,668 | 19.0% | 29.0% |
| 60 | Antioch, CA | 116,477 | 15.0% | 24.0% |
| 61 | Milwaukee, WI | 566,973 | 16.0% | 27.0% |
| 62 | Greeley, CO | 110,806 | 16.0% | 28.0% |
| 63 | Visalia, CA | 143,939 | 14.0% | 24.0% |
| 64 | San Antonio, TX | 1,479,835 | 16.0% | 29.0% |
| 65 | Gresham, OR | 112,378 | 13.0% | 23.0% |
| 66 | Wichita Falls, TX | 102,581 | 14.0% | 25.0% |
| 67 | Grand Prairie, TX | 201,883 | 18.0% | 30.0% |
| 68 | Joliet, IL | 150,445 | 14.0% | 26.0% |
| 69 | Lowell, MA | 118,368 | 17.0% | 30.0% |
| 70 | Mcallen, TX | 145,385 | 20.0% | 33.0% |
| 71 | Augusta-Richmond County Consolidated Government (Balance), GA | 201,528 | 13.0% | 24.0% |
| 72 | Richmond, CA | 115,505 | 21.0% | 33.0% |
| 73 | Syracuse, NY | 146,384 | 17.0% | 30.0% |
| 74 | Beaumont, TX | 113,279 | 13.0% | 25.0% |
| 75 | Jackson, MS | 146,631 | 14.0% | 28.0% |
| 76 | Las Vegas, NV | 660,400 | 14.0% | 28.0% |
| 77 | Akron, OH | 189,247 | 12.0% | 23.0% |
| 78 | Fairfield, CA | 120,785 | 13.0% | 26.0% |
| 79 | Hayward, CA | 158,801 | 19.0% | 33.0% |
| 80 | Rochester, NY | 208,772 | 16.0% | 30.0% |
| 81 | Independence, MO | 121,740 | 11.0% | 22.0% |
| 82 | Memphis, TN | 618,980 | 14.0% | 28.0% |
| 83 | Dayton, OH | 136,579 | 11.0% | 22.0% |
| 84 | Toledo, OH | 267,463 | 11.0% | 22.0% |
| 85 | Abilene, TX | 128,053 | 13.0% | 27.0% |
| 86 | Amarillo, TX | 201,885 | 13.0% | 27.0% |
| 87 | Sparks, NV | 110,024 | 13.0% | 28.0% |
| 88 | West Covina, CA | 107,037 | 15.0% | 30.0% |
| 89 | Nampa, ID | 110,319 | 11.0% | 23.0% |
| 90 | Menifee, CA | 110,305 | 11.0% | 23.0% |
| 91 | Kent, WA | 135,603 | 14.0% | 30.0% |
| 92 | Vallejo, CA | 124,268 | 13.0% | 29.0% |
| 93 | Waco, TX | 143,570 | 13.0% | 29.0% |
| 94 | South Bend, IN | 103,085 | 13.0% | 29.0% |
| 95 | Providence, RI | 191,767 | 18.0% | 34.0% |
| 96 | Arlington, TX | 397,742 | 15.0% | 32.0% |
| 97 | Houston, TX | 2,328,253 | 20.0% | 37.0% |
| 98 | Phoenix, AZ | 1,642,323 | 15.0% | 33.0% |
| 99 | Corona, CA | 159,670 | 14.0% | 32.0% |
| 100 | Evansville, IN | 116,116 | 10.0% | 23.0% |
Source: U.S. Census ACS 2020-2024. The 326 largest US cities.
Summary
There You Have It — The Dumbest Big Cities in America
If you’re measuring the locations in America with many dropouts, few libraries, and where people tend to be less educated, this is an accurate list.
The dumbest cities in the United States are Santa Maria, CA, Paterson, NJ, El Monte, CA, Salinas, CA, Rialto, CA, Elizabeth, NJ, Hesperia, CA, Pasadena, TX, Jurupa Valley, CA, and Santa Ana, CA.
Questions and answers
Dumbest Cities In America FAQs
What is the dumbest city in America?
Santa Maria, CA ranks as the dumbest city in America for 2026, going purely by adult educational attainment. Paterson and El Monte are next.
What are the dumbest cities in the US?
The lowest-ranked big cities are Santa Maria, CA, Paterson, NJ, El Monte, CA, Salinas, CA, Rialto, CA, Elizabeth, NJ, Hesperia, CA, Pasadena, TX, Jurupa Valley, CA, and Santa Ana, CA. We ranked the 326 largest US cities on adult high-school-dropout and college-degree rates.
Which big city has the best education numbers?
Ann Arbor, MI posts the best educational attainment numbers of the 326 biggest US cities. It anchors the smart end of this table.
How do you rank the dumbest cities?
Two Census American Community Survey measures: the share of adults without a high school diploma and the share with a college degree. The worst combination tops the list.
Does this actually measure how smart people are?
No — it measures schooling, not smarts. Diplomas are the only education data tracked consistently across every city, and they say nothing about any individual.