100 Biggest Cities In Michigan For 2026
Using the latest Census data, we detail the 100 biggest cities in Michigan. You can all see a comprehensive list of all 435 cities and places in Michigan.

We all love the biggest cities that the Wolverine State has to offer. You know the places like Detroit and Grand Rapids which make all the headlines.
But there are a bunch of other great large cities in Michigan that don't get as much love.
We're going to change that right now.
Using the most recent Census data, we can tell you about all the places in Michigan with a focus on the biggest. We update the data each year and this is our fourth time doing this.
Table Of Contents: Top Ten | Methodology | Table
The Largest Cities In Michigan For 2026:
You can click here to see a full table of the full of the 100 biggest cities in Michigan, along with every other place over 1,000 people big. It is sortable by clicking on the headers.
Read on below to see more on the biggest cities. Or for more reading on places to live in Michigan, check out:
- Best Places To Live In Michigan
- Cheapest Places To Live In Michigan
- Most Dangerous Places in Michigan
The 10 Biggest Cities In Michigan

/10
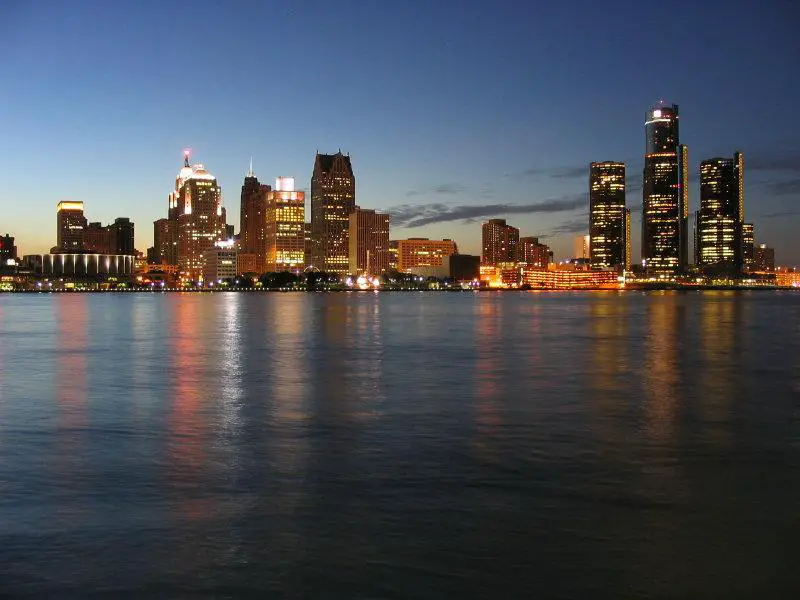
Rank Last Year: 1 (No Change)
Population: 638,530.0
Population 2010: 759,340
Growth: -15.9%
More on Detroit: Data | Crime | Cost Of Living | Real Estate

/10
Rank Last Year: 2 (No Change)
Population: 198,535.0
Population 2010: 190,441
Growth: 4.3%
More on Grand Rapids: Data | Crime | Cost Of Living | Real Estate

/10
Rank Last Year: 3 (No Change)
Population: 137,928.0
Population 2010: 135,791
Growth: 1.6%
More on Warren: Data | Crime | Cost Of Living | Real Estate

/10
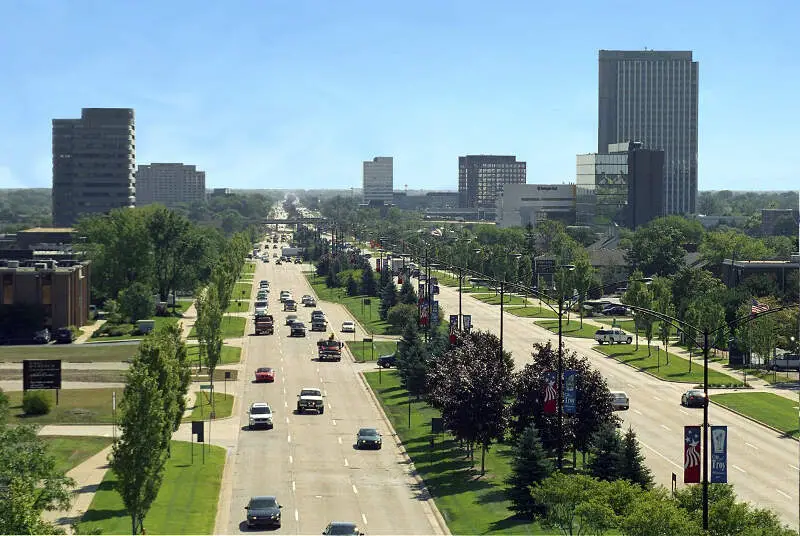
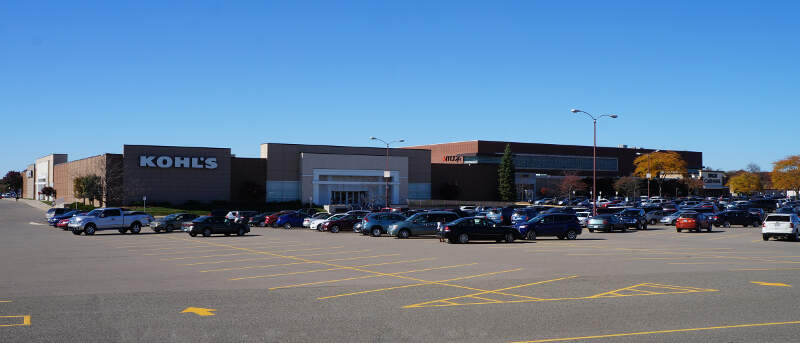
Rank Last Year: 4 (No Change)
Population: 133,573.0
Population 2010: 129,687
Growth: 3.0%
More on Sterling Heights: Data | Crime | Cost Of Living | Real Estate

/10
Rank Last Year: 5 (No Change)
Population: 122,036.0
Population 2010: 115,204
Growth: 5.9%
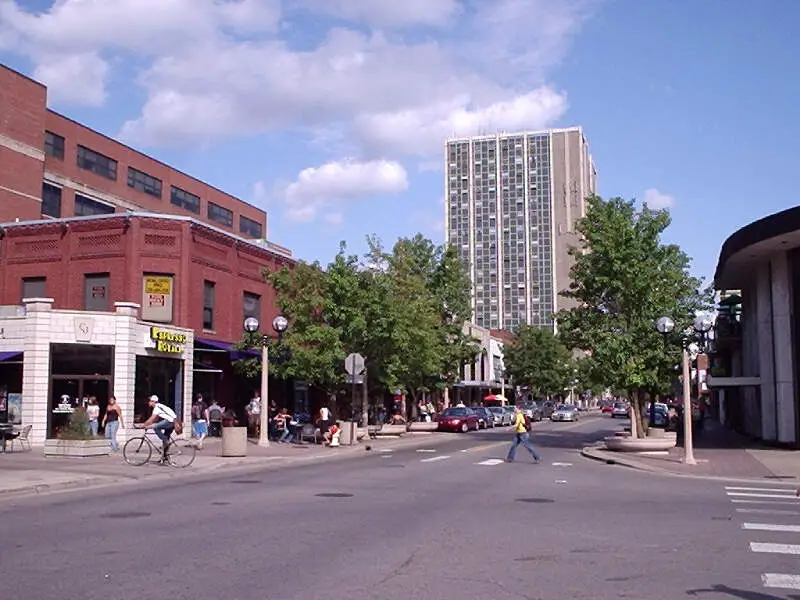
More on Ann Arbor: Data | Crime | Cost Of Living | Real Estate

/10
Rank Last Year: 6 (No Change)
Population: 113,023.0
Population 2010: 115,634
Growth: -2.3%
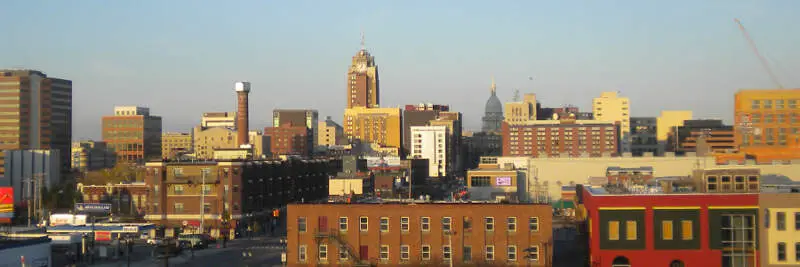
More on Lansing: Data | Crime | Cost Of Living | Real Estate

/10
Rank Last Year: 7 (No Change)
Population: 107,423.0
Population 2010: 98,392
Growth: 9.2%
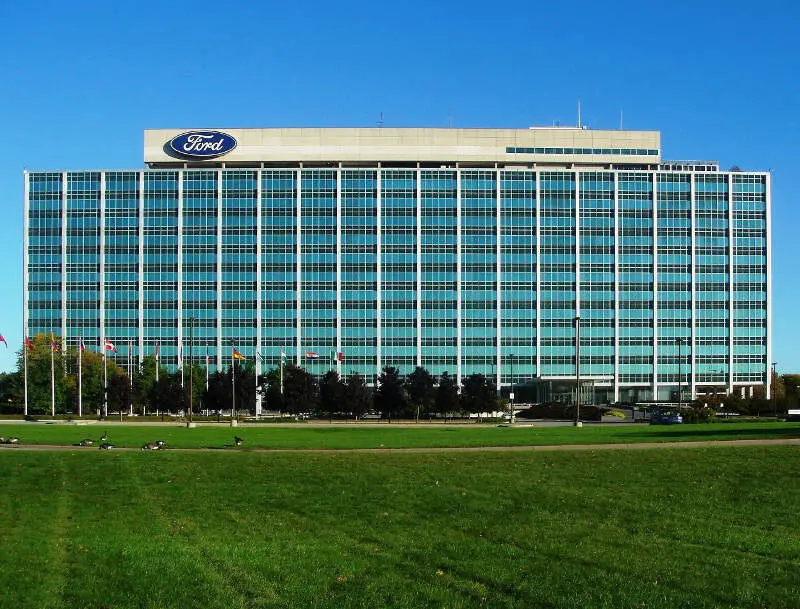
More on Dearborn: Data | Crime | Cost Of Living | Real Estate

/10
Rank Last Year: 8 (No Change)
Population: 93,851.0
Population 2010: 97,915
Growth: -4.2%
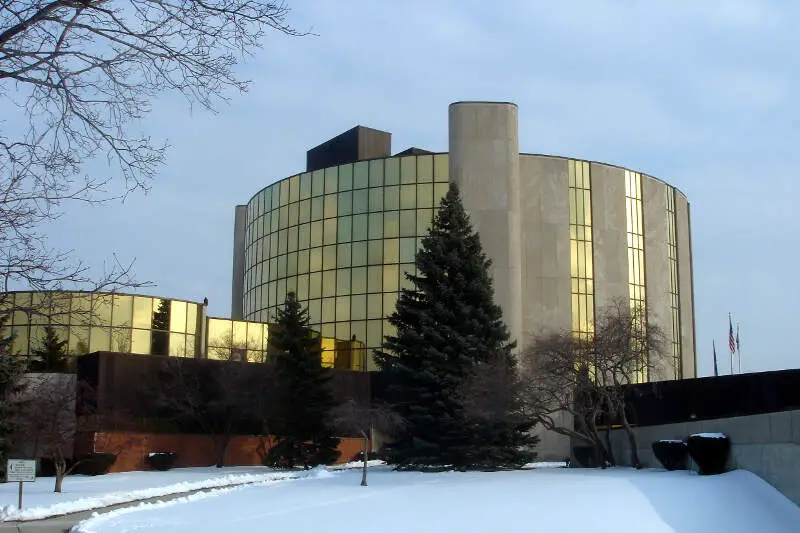
More on Livonia: Data | Crime | Cost Of Living | Real Estate

/10
Rank Last Year: 9 (No Change)
Population: 87,898.0
Population 2010: 80,987
Growth: 8.5%
More on Troy: Data | Crime | Cost Of Living | Real Estate

/10
Rank Last Year: 10 (No Change)
Population: 83,633.0
Population 2010: 84,832
Growth: -1.4%
More on Westland: Data | Crime | Cost Of Living | Real Estate
How We Determined The Largest Cities In Michigan
We've been ranking and dissecting cities in the Wolverine State for over 4 years now -- making this actually the fourth time we've run the numbers. We always use the best data, the US Census. In this case, that means we are using the American Community Survey.
It what is probably the most simple analysis we run each year, we ranked every place in Michigan from biggest to smallest. The biggest city this year? That would be Detroit.
The smallest? Elsie, although there are places smaller than 1,000 people not listed here, so keep that in mind as we take a look at the top ten.
Now on to numbers 11-100 Biggest in Michigan
We hope that you find the big city, or really any city, that's right for you. Below is a list of the rest of the biggest cities along with every other place in Michigan.
Have fun snacking around in the Wolverine State!
For more reading on Michigan, check out:
- Best Places To Raise A Family In Michigan
- Best Places To Retire In Michigan
- Richest Cities In Michigan
- Safest Places In Michigan
- Worst Places To Live In Michigan
- Most Expensive Places To Live In Michigan
Detailed List Of The Biggest Cities In Michigan
| Rank | City | Current Population | 2010 | Growth | |||||
|---|---|---|---|---|---|---|---|---|---|
| 1 | Detroit | 638,530.0 | 759,340 | -15.9% | |||||
| 2 | Grand Rapids | 198,535.0 | 190,441 | 4.3% | |||||
| 3 | Warren | 137,928.0 | 135,791 | 1.6% | |||||
| 4 | Sterling Heights | 133,573.0 | 129,687 | 3.0% | |||||
| 5 | Ann Arbor | 122,036.0 | 115,204 | 5.9% | |||||
| 6 | Lansing | 113,023.0 | 115,634 | -2.3% | |||||
| 7 | Dearborn | 107,423.0 | 98,392 | 9.2% | |||||
| 8 | Livonia | 93,851.0 | 97,915 | -4.2% | |||||
| 9 | Troy | 87,898.0 | 80,987 | 8.5% | |||||
| 10 | Westland | 83,633.0 | 84,832 | -1.4% | |||||
| 11 | Farmington Hills | 83,515.0 | 80,191 | 4.1% | |||||
| 12 | Flint | 80,175.0 | 107,807 | -25.6% | |||||
| 13 | Wyoming | 77,353.0 | 71,816 | 7.7% | |||||
| 14 | Rochester Hills | 77,089.0 | 70,606 | 9.2% | |||||
| 15 | Southfield | 76,236.0 | 72,949 | 4.5% | |||||
| 16 | Kalamazoo | 73,076.0 | 74,318 | -1.7% | |||||
| 17 | Novi | 66,717.0 | 53,823 | 24.0% | |||||
| 18 | Pontiac | 62,104.0 | 60,982 | 1.8% | |||||
| 19 | Taylor | 62,081.0 | 63,833 | -2.7% | |||||
| 20 | Dearborn Heights | 61,771.0 | 58,066 | 6.4% | |||||
| 21 | St. Clair Shores | 58,140.0 | 60,776 | -4.3% | |||||
| 22 | Royal Oak | 57,950.0 | 57,741 | 0.4% | |||||
| 23 | Kentwood | 54,296.0 | 48,242 | 12.5% | |||||
| 24 | Battle Creek | 52,374.0 | 52,762 | -0.7% | |||||
| 25 | Portage | 49,259.0 | 45,916 | 7.3% | |||||
| 26 | Roseville | 47,123.0 | 47,830 | -1.5% | |||||
| 27 | East Lansing | 45,758.0 | 48,220 | -5.1% | |||||
| 28 | Saginaw | 43,536.0 | 53,463 | -18.6% | |||||
| 29 | Midland | 42,724.0 | 41,961 | 1.8% | |||||
| 30 | Lincoln Park | 39,257.0 | 38,595 | 1.7% | |||||
| 31 | Muskegon | 37,226.0 | 39,023 | -4.6% | |||||
| 32 | Holland | 34,423.0 | 33,708 | 2.1% | |||||
| 33 | Eastpointe | 33,982.0 | 32,944 | 3.2% | |||||
| 34 | Bay City | 32,320.0 | 35,235 | -8.3% | |||||
| 35 | Jackson | 31,058.0 | 34,349 | -9.6% | |||||
| 36 | Burton | 29,500.0 | 30,439 | -3.1% | |||||
| 37 | Southgate | 29,366.0 | 30,160 | -2.6% | |||||
| 38 | Oak Park | 29,318.0 | 29,892 | -1.9% | |||||
| 39 | Forest Hills | 28,695.0 | 25,428 | 12.8% | |||||
| 40 | Port Huron | 28,620.0 | 31,024 | -7.7% | |||||
| 41 | Madison Heights | 28,419.0 | 29,954 | -5.1% | |||||
| 42 | Allen Park | 27,925.0 | 28,542 | -2.2% | |||||
| 43 | Hamtramck | 27,743.0 | 22,594 | 22.8% | |||||
| 44 | Garden City | 26,739.0 | 28,199 | -5.2% | |||||
| 45 | Allendale | 26,679.0 | 16,652 | 60.2% | |||||
| 46 | Okemos | 26,396.0 | 21,025 | 25.5% | |||||
| 47 | Inkster | 25,428.0 | 26,311 | -3.4% | |||||
| 48 | Walker | 25,386.0 | 23,290 | 9.0% | |||||
| 49 | Holt | 25,316.0 | 23,595 | 7.3% | |||||
| 50 | Auburn Hills | 25,105.0 | 21,162 | 18.6% | |||||
| 51 | Norton Shores | 25,041.0 | 23,916 | 4.7% | |||||
| 52 | Romulus | 24,831.0 | 23,874 | 4.0% | |||||
| 53 | Wyandotte | 24,489.0 | 26,368 | -7.1% | |||||
| 54 | Waverly | 23,575.0 | 24,737 | -4.7% | |||||
| 55 | Birmingham | 21,763.0 | 19,962 | 9.0% | |||||
| 56 | Marquette | 21,325.0 | 21,247 | 0.4% | |||||
| 57 | Mount Pleasant | 21,236.0 | 26,119 | -18.7% | |||||
| 58 | Adrian | 20,395.0 | 21,554 | -5.4% | |||||
| 59 | Monroe | 20,320.0 | 21,180 | -4.1% | |||||
| 60 | Ypsilanti | 19,857.0 | 20,191 | -1.7% | |||||
| 61 | Ferndale | 19,190.0 | 20,286 | -5.4% | |||||
| 62 | Cutlerville | 18,780.0 | 13,982 | 34.3% | |||||
| 63 | Haslett | 18,559.0 | 19,716 | -5.9% | |||||
| 64 | Trenton | 18,125.0 | 19,051 | -4.9% | |||||
| 65 | Jenison | 17,582.0 | 17,236 | 2.0% | |||||
| 66 | Wayne | 17,310.0 | 17,924 | -3.4% | |||||
| 67 | Wixom | 17,295.0 | 13,456 | 28.5% | |||||
| 68 | Grandville | 16,356.0 | 15,598 | 4.9% | |||||
| 69 | Grosse Pointe Woods | 16,094.0 | 16,357 | -1.6% | |||||
| 70 | Traverse City | 15,593.0 | 14,772 | 5.6% | |||||
| 71 | Mount Clemens | 15,511.0 | 16,616 | -6.7% | |||||
| 72 | Northview | 15,268.0 | 14,425 | 5.8% | |||||
| 73 | Berkley | 15,149.0 | 15,063 | 0.6% | |||||
| 74 | Harper Woods | 15,116.0 | 14,296 | 5.7% | |||||
| 75 | Hazel Park | 14,963.0 | 16,876 | -11.3% | |||||
| 76 | Owosso | 14,632.0 | 15,452 | -5.3% | |||||
| 77 | Fraser | 14,583.0 | 14,739 | -1.1% | |||||
| 78 | Coldwater | 13,671.0 | 10,979 | 24.5% | |||||
| 79 | Sault Ste. Marie | 13,335.0 | 14,382 | -7.3% | |||||
| 80 | Rochester | 12,934.0 | 12,312 | 5.1% | |||||
| 81 | Ionia | 12,753.0 | 12,030 | 6.0% | |||||
| 82 | Woodhaven | 12,690.0 | 12,862 | -1.3% | |||||
| 83 | Melvindale | 12,554.0 | 10,759 | 16.7% | |||||
| 84 | Escanaba | 12,354.0 | 12,735 | -3.0% | |||||
| 85 | Riverview | 12,186.0 | 12,640 | -3.6% | |||||
| 86 | New Baltimore | 12,072.0 | 11,327 | 6.6% | |||||
| 87 | South Lyon | 11,950.0 | 11,072 | 7.9% | |||||
| 88 | Fenton | 11,906.0 | 11,675 | 2.0% | |||||
| 89 | Niles | 11,803.0 | 11,655 | 1.3% | |||||
| 90 | Farmington | 11,504.0 | 10,380 | 10.8% | |||||
| 91 | East Grand Rapids | 11,445.0 | 10,734 | 6.6% | |||||
| 92 | Clawson | 11,374.0 | 11,995 | -5.2% | |||||
| 93 | Grosse Pointe Park | 11,319.0 | 11,755 | -3.7% | |||||
| 94 | Sturgis | 11,054.0 | 11,104 | -0.5% | |||||
| 95 | Grand Haven | 10,996.0 | 10,640 | 3.3% | |||||
| 96 | Comstock Park | 10,577.0 | 10,319 | 2.5% | |||||
| 97 | Beverly Hills | 10,524.0 | 10,284 | 2.3% | |||||
| 98 | Cadillac | 10,445.0 | 10,384 | 0.6% | |||||
| 99 | Flat Rock | 10,340.0 | 9,666 | 7.0% | |||||
| 100 | Alpena | 10,154.0 | 10,649 | -4.6% | |||||
| 101 | Howell | 10,021.0 | 9,685 | 3.5% | |||||
| 102 | Lambertville | 9,955.0 | 10,248 | -2.9% | |||||
| 103 | Marysville | 9,925.0 | 10,057 | -1.3% | |||||
| 104 | Grosse Pointe Farms | 9,904.0 | 9,561 | 3.6% | |||||
| 105 | Muskegon Heights | 9,841.0 | 11,157 | -11.8% | |||||
| 106 | Alma | 9,396.0 | 9,384 | 0.1% | |||||
| 107 | Charlotte | 9,277.0 | 9,126 | 1.7% | |||||
| 108 | Plymouth | 9,214.0 | 9,136 | 0.9% | |||||
| 109 | Lapeer | 9,082.0 | 9,077 | 0.1% | |||||
| 110 | Ecorse | 9,064.0 | 9,845 | -7.9% | |||||
| 111 | Saline | 9,006.0 | 8,744 | 3.0% | |||||
| 112 | Greenville | 8,995.0 | 8,470 | 6.2% | |||||
| 113 | Benton Harbor | 8,953.0 | 10,256 | -12.7% | |||||
| 114 | Temperance | 8,914.0 | 8,439 | 5.6% | |||||
| 115 | Westwood | 8,867.0 | 9,057 | -2.1% | |||||
| 116 | Tecumseh | 8,646.0 | 8,652 | -0.1% | |||||
| 117 | Highland Park | 8,628.0 | 12,714 | -32.1% | |||||
| 118 | Big Rapids | 8,477.0 | 10,696 | -20.7% | |||||
| 119 | Houghton | 8,474.0 | 7,573 | 11.9% | |||||
| 120 | Center Line | 8,463.0 | 8,374 | 1.1% | |||||
| 121 | Beecher | 8,412.0 | 11,842 | -29.0% | |||||
| 122 | Menominee | 8,326.0 | 8,689 | -4.2% | |||||
| 123 | Flushing | 8,284.0 | 8,479 | -2.3% | |||||
| 124 | Mason | 8,249.0 | 8,074 | 2.2% | |||||
| 125 | Hillsdale | 8,002.0 | 8,352 | -4.2% | |||||
| 126 | Grand Blanc | 7,987.0 | 8,395 | -4.9% | |||||
| 127 | St. Joseph | 7,986.0 | 8,394 | -4.9% | |||||
| 128 | Three Rivers | 7,943.0 | 7,802 | 1.8% | |||||
| 129 | Whitmore Lake | 7,878.0 | 6,826 | 15.4% | |||||
| 130 | Grand Ledge | 7,804.0 | 7,852 | -0.6% | |||||
| 131 | Hudsonville | 7,769.0 | 7,181 | 8.2% | |||||
| 132 | St. Johns | 7,715.0 | 7,920 | -2.6% | |||||
| 133 | Brighton | 7,688.0 | 7,500 | 2.5% | |||||
| 134 | Ludington | 7,676.0 | 8,166 | -6.0% | |||||
| 135 | Albion | 7,560.0 | 8,750 | -13.6% | |||||
| 136 | Freeland | 7,557.0 | 6,999 | 8.0% | |||||
| 137 | Hastings | 7,520.0 | 7,395 | 1.7% | |||||
| 138 | Iron Mountain | 7,518.0 | 7,787 | -3.5% | |||||
| 139 | Byron Center | 7,403.0 | 5,044 | 46.8% | |||||
| 140 | Shields | 7,402.0 | 6,821 | 8.5% | |||||
| 141 | St. Louis | 7,367.0 | 7,382 | -0.2% | |||||
| 142 | Fair Plain | 7,330.0 | 7,486 | -2.1% | |||||
| 143 | Walled Lake | 7,299.0 | 6,941 | 5.2% | |||||
| 144 | River Rouge | 7,008.0 | 8,299 | -15.6% | |||||
| 145 | South Monroe | 6,960.0 | 7,065 | -1.5% | |||||
| 146 | Bridgeport | 6,884.0 | 6,958 | -1.1% | |||||
| 147 | Marshall | 6,804.0 | 7,160 | -5.0% | |||||
| 148 | Eastwood | 6,669.0 | 6,183 | 7.9% | |||||
| 149 | Milford | 6,487.0 | 6,193 | 4.7% | |||||
| 150 | New Haven | 6,475.0 | 4,361 | 48.5% | |||||
| 151 | Lake Fenton | 6,417.0 | 5,315 | 20.7% | |||||
| 152 | Huntington Woods | 6,328.0 | 6,209 | 1.9% | |||||
| 153 | Manistee | 6,275.0 | 6,362 | -1.4% | |||||
| 154 | Rockford | 6,218.0 | 5,538 | 12.3% | |||||
| 155 | Ishpeming | 6,181.0 | 6,501 | -4.9% | |||||
| 156 | Northville | 6,069.0 | 6,063 | 0.1% | |||||
| 157 | Milan | 5,987.0 | 5,668 | 5.6% | |||||
| 158 | Holly | 5,964.0 | 6,105 | -2.3% | |||||
| 159 | Belding | 5,960.0 | 5,864 | 1.6% | |||||
| 160 | Petoskey | 5,856.0 | 5,795 | 1.1% | |||||
| 161 | Richmond | 5,855.0 | 5,630 | 4.0% | |||||
| 162 | Swartz Creek | 5,853.0 | 5,712 | 2.5% | |||||
| 163 | Buena Vista | 5,798.0 | 6,553 | -11.5% | |||||
| 164 | Houghton Lake | 5,769.0 | 3,390 | 70.2% | |||||
| 165 | Dundee | 5,744.0 | 3,935 | 46.0% | |||||
| 166 | Dowagiac | 5,732.0 | 5,930 | -3.3% | |||||
| 167 | Zeeland | 5,665.0 | 5,610 | 1.0% | |||||
| 168 | St. Clair | 5,585.0 | 5,634 | -0.9% | |||||
| 169 | Grosse Pointe | 5,541.0 | 5,478 | 1.2% | |||||
| 170 | Chelsea | 5,426.0 | 4,875 | 11.3% | |||||
| 171 | Comstock Northwest | 5,391.0 | 6,376 | -15.4% | |||||
| 172 | Springfield | 5,269.0 | 5,267 | 0.0% | |||||
| 173 | Gladstone | 5,253.0 | 5,000 | 5.1% | |||||
| 174 | Eaton Rapids | 5,183.0 | 5,275 | -1.7% | |||||
| 175 | Utica | 5,180.0 | 4,757 | 8.9% | |||||
| 176 | Allegan | 5,172.0 | 4,986 | 3.7% | |||||
| 177 | Frankenmuth | 5,157.0 | 4,945 | 4.3% | |||||
| 178 | Kingsford | 5,124.0 | 5,238 | -2.2% | |||||
| 179 | Davison | 5,076.0 | 5,324 | -4.7% | |||||
| 180 | Michigan Center | 4,999.0 | 4,772 | 4.8% | |||||
| 181 | Ironwood | 4,997.0 | 5,490 | -9.0% | |||||
| 182 | Gibraltar | 4,873.0 | 4,601 | 5.9% | |||||
| 183 | Coopersville | 4,848.0 | 4,250 | 14.1% | |||||
| 184 | Cheboygan | 4,820.0 | 5,023 | -4.0% | |||||
| 185 | Dewitt | 4,777.0 | 4,591 | 4.1% | |||||
| 186 | Negaunee | 4,656.0 | 4,564 | 2.0% | |||||
| 187 | Wolf Lake | 4,654.0 | 4,086 | 13.9% | |||||
| 188 | Hancock | 4,574.0 | 4,568 | 0.1% | |||||
| 189 | Fremont | 4,568.0 | 4,170 | 9.5% | |||||
| 190 | Pearl Beach | 4,506.0 | 3,148 | 43.1% | |||||
| 191 | Wolverine Lake | 4,487.0 | 4,342 | 3.3% | |||||
| 192 | Wayland | 4,457.0 | 4,079 | 9.3% | |||||
| 193 | Bloomfield Hills | 4,415.0 | 3,879 | 13.8% | |||||
| 194 | Middleville | 4,380.0 | 3,271 | 33.9% | |||||
| 195 | Vandercook Lake | 4,375.0 | 4,782 | -8.5% | |||||
| 196 | Gaylord | 4,357.0 | 3,732 | 16.7% | |||||
| 197 | Caro | 4,290.0 | 0 | nan% | |||||
| 198 | Sparta | 4,271.0 | 4,154 | 2.8% | |||||
| 199 | Buchanan | 4,223.0 | 4,483 | -5.8% | |||||
| 200 | Linden | 4,160.0 | 3,843 | 8.2% | |||||
| 201 | Roosevelt Park | 4,144.0 | 3,876 | 6.9% | |||||
| 202 | Lowell | 4,139.0 | 3,820 | 8.4% | |||||
| 203 | Algonac | 4,139.0 | 4,253 | -2.7% | |||||
| 204 | North Muskegon | 4,098.0 | 3,862 | 6.1% | |||||
| 205 | Otsego | 4,074.0 | 3,983 | 2.3% | |||||
| 206 | Lathrup Village | 4,059.0 | 4,101 | -1.0% | |||||
| 207 | Marine City | 4,028.0 | 4,374 | -7.9% | |||||
| 208 | South Haven | 3,998.0 | 4,550 | -12.1% | |||||
| 209 | Vicksburg | 3,934.0 | 2,886 | 36.3% | |||||
| 210 | Belleville | 3,910.0 | 4,000 | -2.2% | |||||
| 211 | Paw Paw Lake | 3,889.0 | 3,122 | 24.6% | |||||
| 212 | Boyne City | 3,825.0 | 3,760 | 1.7% | |||||
| 213 | Williamston | 3,807.0 | 3,783 | 0.6% | |||||
| 214 | Portland | 3,790.0 | 3,902 | -2.9% | |||||
| 215 | Plainwell | 3,763.0 | 3,861 | -2.5% | |||||
| 216 | Imlay City | 3,721.0 | 3,701 | 0.5% | |||||
| 217 | Cedar Springs | 3,670.0 | 3,467 | 5.9% | |||||
| 218 | Romeo | 3,578.0 | 3,440 | 4.0% | |||||
| 219 | Level Park-Oak Park | 3,488.0 | 3,696 | -5.6% | |||||
| 220 | Durand | 3,483.0 | 3,572 | -2.5% | |||||
| 221 | Oxford | 3,474.0 | 3,448 | 0.8% | |||||
| 222 | Essexville | 3,327.0 | 3,521 | -5.5% | |||||
| 223 | Clare | 3,324.0 | 3,196 | 4.0% | |||||
| 224 | Paw Paw | 3,289.0 | 3,500 | -6.0% | |||||
| 225 | Blissfield | 3,234.0 | 3,455 | -6.4% | |||||
| 226 | Rockwood | 3,161.0 | 3,323 | -4.9% | |||||
| 227 | Mount Morris | 3,117.0 | 3,141 | -0.8% | |||||
| 228 | Gladwin | 3,098.0 | 2,967 | 4.4% | |||||
| 229 | Potterville | 3,087.0 | 2,555 | 20.8% | |||||
| 230 | Benton Heights | 3,078.0 | 4,103 | -25.0% | |||||
| 231 | Corunna | 3,037.0 | 3,515 | -13.6% | |||||
| 232 | Whitehall | 3,024.0 | 2,772 | 9.1% | |||||
| 233 | Skidway Lake | 3,008.0 | 3,509 | -14.3% | |||||
| 234 | Iron River | 3,002.0 | 3,094 | -3.0% | |||||
| 235 | Bad Axe | 2,992.0 | 3,182 | -6.0% | |||||
| 236 | Canadian Lakes | 2,991.0 | 2,758 | 8.4% | |||||
| 237 | Ferrysburg | 2,959.0 | 2,931 | 1.0% | |||||
| 238 | St. Helen | 2,929.0 | 2,706 | 8.2% | |||||
| 239 | Fowlerville | 2,918.0 | 2,979 | -2.0% | |||||
| 240 | Bath | 2,896.0 | 2,275 | 27.3% | |||||
| 241 | Harvey | 2,880.0 | 1,488 | 93.5% | |||||
| 242 | Rogers City | 2,878.0 | 2,946 | -2.3% | |||||
| 243 | Manistique | 2,863.0 | 3,263 | -12.3% | |||||
| 244 | Lake Orion | 2,863.0 | 2,936 | -2.5% | |||||
| 245 | West Ishpeming | 2,851.0 | 2,872 | -0.7% | |||||
| 246 | Almont | 2,838.0 | 2,742 | 3.5% | |||||
| 247 | Norway | 2,833.0 | 2,896 | -2.2% | |||||
| 248 | Ithaca | 2,817.0 | 2,953 | -4.6% | |||||
| 249 | K. I. Sawyer | 2,817.0 | 2,405 | 17.1% | |||||
| 250 | Village Of Grosse Pointe Shores | 2,795.0 | 2,976 | -6.1% | |||||
| 251 | Beechwood | 2,776.0 | 3,309 | -16.1% | |||||
| 252 | Detroit Beach | 2,771.0 | 1,770 | 56.6% | |||||
| 253 | Keego Harbor | 2,747.0 | 2,929 | -6.2% | |||||
| 254 | West Monroe | 2,711.0 | 3,112 | -12.9% | |||||
| 255 | Vassar | 2,707.0 | 2,722 | -0.6% | |||||
| 256 | Sandusky | 2,694.0 | 2,740 | -1.7% | |||||
| 257 | Mattawan | 2,692.0 | 2,027 | 32.8% | |||||
| 258 | East Tawas | 2,675.0 | 2,861 | -6.5% | |||||
| 259 | Pleasant Ridge | 2,602.0 | 2,556 | 1.8% | |||||
| 260 | Carleton | 2,595.0 | 2,587 | 0.3% | |||||
| 261 | Shelby | 2,577.0 | 2,293 | 12.4% | |||||
| 262 | Franklin | 2,554.0 | 3,139 | -18.6% | |||||
| 263 | Edgemont Park | 2,551.0 | 2,295 | 11.2% | |||||
| 264 | Kalkaska | 2,539.0 | 2,200 | 15.4% | |||||
| 265 | Clinton | 2,536.0 | 2,546 | -0.4% | |||||
| 266 | Montague | 2,531.0 | 2,123 | 19.2% | |||||
| 267 | Manchester | 2,522.0 | 2,160 | 16.8% | |||||
| 268 | Spring Lake | 2,519.0 | 2,410 | 4.5% | |||||
| 269 | Reed City | 2,517.0 | 2,705 | -7.0% | |||||
| 270 | Newaygo | 2,512.0 | 2,081 | 20.7% | |||||
| 271 | Croswell | 2,488.0 | 2,611 | -4.7% | |||||
| 272 | Chesaning | 2,484.0 | 2,274 | 9.2% | |||||
| 273 | St. Ignace | 2,463.0 | 2,619 | -6.0% | |||||
| 274 | Hartford | 2,458.0 | 2,662 | -7.7% | |||||
| 275 | Trowbridge Park | 2,396.0 | 2,200 | 8.9% | |||||
| 276 | Charlevoix | 2,392.0 | 2,620 | -8.7% | |||||
| 277 | Spring Arbor | 2,275.0 | 2,192 | 3.8% | |||||
| 278 | Orchard Lake Village | 2,238.0 | 2,127 | 5.2% | |||||
| 279 | West Branch | 2,225.0 | 2,238 | -0.6% | |||||
| 280 | Cass City | 2,210.0 | 2,577 | -14.2% | |||||
| 281 | Hudson | 2,200.0 | 2,125 | 3.5% | |||||
| 282 | Argentine | 2,190.0 | 2,241 | -2.3% | |||||
| 283 | Clio | 2,185.0 | 2,646 | -17.4% | |||||
| 284 | Watervliet | 2,156.0 | 1,679 | 28.4% | |||||
| 285 | Lake Odessa | 2,155.0 | 2,284 | -5.6% | |||||
| 286 | Constantine | 2,154.0 | 1,895 | 13.7% | |||||
| 287 | Morenci | 2,137.0 | 2,414 | -11.5% | |||||
| 288 | Leslie | 2,129.0 | 1,931 | 10.3% | |||||
| 289 | Yale | 2,129.0 | 1,917 | 11.1% | |||||
| 290 | Bangor | 2,129.0 | 2,078 | 2.5% | |||||
| 291 | Auburn | 2,124.0 | 2,183 | -2.7% | |||||
| 292 | Harrison | 2,110.0 | 1,849 | 14.1% | |||||
| 293 | Lawton | 2,104.0 | 1,949 | 8.0% | |||||
| 294 | Manitou Beach-Devils Lake | 2,103.0 | 2,133 | -1.4% | |||||
| 295 | Lake Isabella | 2,085.0 | 2,010 | 3.7% | |||||
| 296 | Bronson | 2,083.0 | 2,061 | 1.1% | |||||
| 297 | Bridgman | 2,077.0 | 2,746 | -24.4% | |||||
| 298 | Perry | 2,073.0 | 2,165 | -4.2% | |||||
| 299 | Indian River | 2,039.0 | 1,736 | 17.5% | |||||
| 300 | Twin Lake | 2,036.0 | 1,782 | 14.3% | |||||
| 301 | Montrose | 2,027.0 | 1,690 | 19.9% | |||||
| 302 | East Jordan | 2,023.0 | 1,927 | 5.0% | |||||
| 303 | Galesburg | 2,023.0 | 1,857 | 8.9% | |||||
| 304 | Goodrich | 2,022.0 | 1,801 | 12.3% | |||||
| 305 | Berrien Springs | 2,018.0 | 2,467 | -18.2% | |||||
| 306 | Saranac | 2,013.0 | 1,556 | 29.4% | |||||
| 307 | Parchment | 2,008.0 | 1,906 | 5.4% | |||||
| 308 | Armada | 1,994.0 | 1,799 | 10.8% | |||||
| 309 | Munising | 1,975.0 | 2,542 | -22.3% | |||||
| 310 | Capac | 1,970.0 | 2,001 | -1.5% | |||||
| 311 | Union City | 1,940.0 | 1,503 | 29.1% | |||||
| 312 | Baraga | 1,939.0 | 2,370 | -18.2% | |||||
| 313 | St. Charles | 1,934.0 | 2,066 | -6.4% | |||||
| 314 | Hart | 1,924.0 | 2,101 | -8.4% | |||||
| 315 | South Rockwood | 1,924.0 | 1,622 | 18.6% | |||||
| 316 | Woodland Beach | 1,919.0 | 1,893 | 1.4% | |||||
| 317 | Pinckney | 1,911.0 | 2,289 | -16.5% | |||||
| 318 | Sebewaing | 1,850.0 | 1,769 | 4.6% | |||||
| 319 | Marlette | 1,850.0 | 2,024 | -8.6% | |||||
| 320 | Olivet | 1,844.0 | 1,583 | 16.5% | |||||
| 321 | Decatur | 1,835.0 | 1,941 | -5.5% | |||||
| 322 | Cassopolis | 1,834.0 | 1,668 | 10.0% | |||||
| 323 | Stony Point | 1,825.0 | 1,791 | 1.9% | |||||
| 324 | South Gull Lake | 1,801.0 | 1,249 | 44.2% | |||||
| 325 | L'anse | 1,790.0 | 2,387 | -25.0% | |||||
| 326 | Kingsley | 1,785.0 | 1,511 | 18.1% | |||||
| 327 | Laingsburg | 1,769.0 | 1,140 | 55.2% | |||||
| 328 | White Pigeon | 1,760.0 | 1,535 | 14.7% | |||||
| 329 | Bessemer | 1,733.0 | 2,096 | -17.3% | |||||
| 330 | Crystal Falls | 1,719.0 | 1,481 | 16.1% | |||||
| 331 | Wacousta | 1,711.0 | 1,146 | 49.3% | |||||
| 332 | Sylvan Lake | 1,705.0 | 1,803 | -5.4% | |||||
| 333 | Wakefield | 1,683.0 | 1,960 | -14.1% | |||||
| 334 | Bingham Farms | 1,680.0 | 1,092 | 53.8% | |||||
| 335 | Grayling | 1,671.0 | 1,917 | -12.8% | |||||
| 336 | Caledonia | 1,671.0 | 1,480 | 12.9% | |||||
| 337 | Evart | 1,667.0 | 1,728 | -3.5% | |||||
| 338 | Brownlee Park | 1,661.0 | 1,968 | -15.6% | |||||
| 339 | Au Sable | 1,643.0 | 1,102 | 49.1% | |||||
| 340 | Howard City | 1,636.0 | 1,612 | 1.5% | |||||
| 341 | Elk Rapids | 1,624.0 | 1,864 | -12.9% | |||||
| 342 | Fennville | 1,623.0 | 1,317 | 23.2% | |||||
| 343 | Tawas City | 1,614.0 | 1,645 | -1.9% | |||||
| 344 | Homer | 1,610.0 | 1,448 | 11.2% | |||||
| 345 | Zilwaukee | 1,609.0 | 1,869 | -13.9% | |||||
| 346 | Harbor Beach | 1,582.0 | 1,792 | -11.7% | |||||
| 347 | Colon | 1,570.0 | 1,407 | 11.6% | |||||
| 348 | Litchfield | 1,566.0 | 1,228 | 27.5% | |||||
| 349 | Centreville | 1,565.0 | 1,428 | 9.6% | |||||
| 350 | Standish | 1,554.0 | 1,964 | -20.9% | |||||
| 351 | Bellevue | 1,552.0 | 1,214 | 27.8% | |||||
| 352 | Morrice | 1,550.0 | 1,173 | 32.1% | |||||
| 353 | Ravenna | 1,540.0 | 1,228 | 25.4% | |||||
| 354 | Hemlock | 1,529.0 | 1,348 | 13.4% | |||||
| 355 | Lakes Of The North | 1,524.0 | 1,238 | 23.1% | |||||
| 356 | Dimondale | 1,521.0 | 1,242 | 22.5% | |||||
| 357 | Greilickville | 1,519.0 | 1,685 | -9.9% | |||||
| 358 | Breckenridge | 1,517.0 | 1,443 | 5.1% | |||||
| 359 | Edmore | 1,514.0 | 1,217 | 24.4% | |||||
| 360 | Manton | 1,511.0 | 1,456 | 3.8% | |||||
| 361 | Laurium | 1,509.0 | 2,151 | -29.8% | |||||
| 362 | Three Oaks | 1,503.0 | 1,848 | -18.7% | |||||
| 363 | Nashville | 1,503.0 | 1,699 | -11.5% | |||||
| 364 | Quincy | 1,484.0 | 1,633 | -9.1% | |||||
| 365 | Mancelona | 1,476.0 | 1,478 | -0.1% | |||||
| 366 | Mio | 1,474.0 | 2,204 | -33.1% | |||||
| 367 | Scottville | 1,474.0 | 1,149 | 28.3% | |||||
| 368 | Edwardsburg | 1,472.0 | 1,280 | 15.0% | |||||
| 369 | Shorewood-Tower Hills-Harbert | 1,459.0 | 1,458 | 0.1% | |||||
| 370 | Shepherd | 1,457.0 | 1,385 | 5.2% | |||||
| 371 | Pinconning | 1,448.0 | 1,187 | 22.0% | |||||
| 372 | Birch Run | 1,439.0 | 1,703 | -15.5% | |||||
| 373 | Gwinn | 1,435.0 | 1,923 | -25.4% | |||||
| 374 | Douglas | 1,427.0 | 897 | 59.1% | |||||
| 375 | Fowler | 1,387.0 | 1,245 | 11.4% | |||||
| 376 | Stockbridge | 1,383.0 | 1,097 | 26.1% | |||||
| 377 | Webberville | 1,375.0 | 1,474 | -6.7% | |||||
| 378 | Ontonagon | 1,355.0 | 1,471 | -7.9% | |||||
| 379 | Prudenville | 1,350.0 | 1,653 | -18.3% | |||||
| 380 | Sand Lake | 1,348.0 | 1,575 | -14.4% | |||||
| 381 | Ortonville | 1,341.0 | 1,365 | -1.8% | |||||
| 382 | Burt | 1,339.0 | 896 | 49.4% | |||||
| 383 | New Buffalo | 1,338.0 | 2,044 | -34.5% | |||||
| 384 | Newberry | 1,329.0 | 1,578 | -15.8% | |||||
| 385 | Rapid City | 1,328.0 | 1,841 | -27.9% | |||||
| 386 | Stanton | 1,285.0 | 1,549 | -17.0% | |||||
| 387 | White Cloud | 1,280.0 | 1,755 | -27.1% | |||||
| 388 | Schoolcraft | 1,275.0 | 1,446 | -11.8% | |||||
| 389 | Reese | 1,274.0 | 1,666 | -23.5% | |||||
| 390 | Baldwin | 1,261.0 | 1,484 | -15.0% | |||||
| 391 | Lakewood Club | 1,255.0 | 1,548 | -18.9% | |||||
| 392 | Luna Pier | 1,244.0 | 1,390 | -10.5% | |||||
| 393 | Carson City | 1,233.0 | 1,024 | 20.4% | |||||
| 394 | Frankfort | 1,225.0 | 1,427 | -14.2% | |||||
| 395 | Fruitport | 1,212.0 | 1,068 | 13.5% | |||||
| 396 | Coleman | 1,206.0 | 1,206 | 0.0% | |||||
| 397 | Kent City | 1,203.0 | 1,146 | 5.0% | |||||
| 398 | Lewiston | 1,201.0 | 1,421 | -15.5% | |||||
| 399 | Chums Corner | 1,186.0 | 833 | 42.4% | |||||
| 400 | Grass Lake | 1,186.0 | 1,189 | -0.3% | |||||
| 401 | Dryden | 1,182.0 | 1,132 | 4.4% | |||||
| 402 | Brooklyn | 1,180.0 | 1,112 | 6.1% | |||||
| 403 | Petersburg | 1,179.0 | 1,207 | -2.3% | |||||
| 404 | North Branch | 1,166.0 | 923 | 26.3% | |||||
| 405 | Weidman | 1,156.0 | 820 | 41.0% | |||||
| 406 | Onsted | 1,155.0 | 890 | 29.8% | |||||
| 407 | Brown City | 1,139.0 | 1,312 | -13.2% | |||||
| 408 | Athens | 1,134.0 | 1,116 | 1.6% | |||||
| 409 | Lexington | 1,126.0 | 1,040 | 8.3% | |||||
| 410 | Millington | 1,122.0 | 1,004 | 11.8% | |||||
| 411 | Roscommon | 1,118.0 | 1,045 | 7.0% | |||||
| 412 | Concord | 1,118.0 | 1,102 | 1.5% | |||||
| 413 | Marcellus | 1,112.0 | 1,046 | 6.3% | |||||
| 414 | Pigeon | 1,100.0 | 985 | 11.7% | |||||
| 415 | Shoreham | 1,100.0 | 871 | 26.3% | |||||
| 416 | Richland | 1,098.0 | 706 | 55.5% | |||||
| 417 | Grant | 1,096.0 | 769 | 42.5% | |||||
| 418 | Stevensville | 1,095.0 | 1,108 | -1.2% | |||||
| 419 | Harbor Springs | 1,086.0 | 1,194 | -9.0% | |||||
| 420 | Coloma | 1,074.0 | 1,527 | -29.7% | |||||
| 421 | Memphis | 1,064.0 | 1,132 | -6.0% | |||||
| 422 | Beaverton | 1,061.0 | 1,050 | 1.0% | |||||
| 423 | Central Lake | 1,051.0 | 1,046 | 0.5% | |||||
| 424 | Fostoria | 1,050.0 | 732 | 43.4% | |||||
| 425 | Dollar Bay | 1,049.0 | 821 | 27.8% | |||||
| 426 | Mayville | 1,045.0 | 1,067 | -2.1% | |||||
| 427 | Deckerville | 1,042.0 | 1,019 | 2.3% | |||||
| 428 | Vineyard Lake | 1,031.0 | 745 | 38.4% | |||||
| 429 | Lakeview | 1,030.0 | 1,066 | -3.4% | |||||
| 430 | Lake Linden | 1,020.0 | 973 | 4.8% | |||||
| 431 | Ossineke | 1,019.0 | 1,068 | -4.6% | |||||
| 432 | Au Gres | 1,018.0 | 902 | 12.9% | |||||
| 433 | Bellaire | 1,008.0 | 1,014 | -0.6% | |||||
| 434 | Lake Victoria | 1,006.0 | 887 | 13.4% | |||||
| 435 | Elsie | 1,000.0 | 884 | 13.1% | |||||