100 Biggest Cities In Washington For 2025
Using the latest Census data, we detail the 100 biggest cities in Washington. You can all see a comprehensive list of all 383 cities and places in Washington.

We all love the biggest cities that the Evergreen State has to offer. You know the places like Seattle and Spokane which make all the headlines.
But there are a bunch of other great large cities in Washington that don't get as much love.
We're going to change that right now.
Using the most recent Census data, we can tell you about all the places in Washington with a focus on the biggest. We update the data each year and this is our fourth time doing this.
Table Of Contents: Top Ten | Methodology | Table
The Largest Cities In Washington For 2025:
You can click here to see a full table of the full of the 100 biggest cities in Washington, along with every other place over 1,000 people big. It is sortable by clicking on the headers.
Read on below to see more on the biggest cities. Or for more reading on places to live in Washington, check out:
- Best Places To Live In Washington
- Cheapest Places To Live In Washington
- Most Dangerous Cities In Washington
The 10 Biggest Cities In Washington

/10
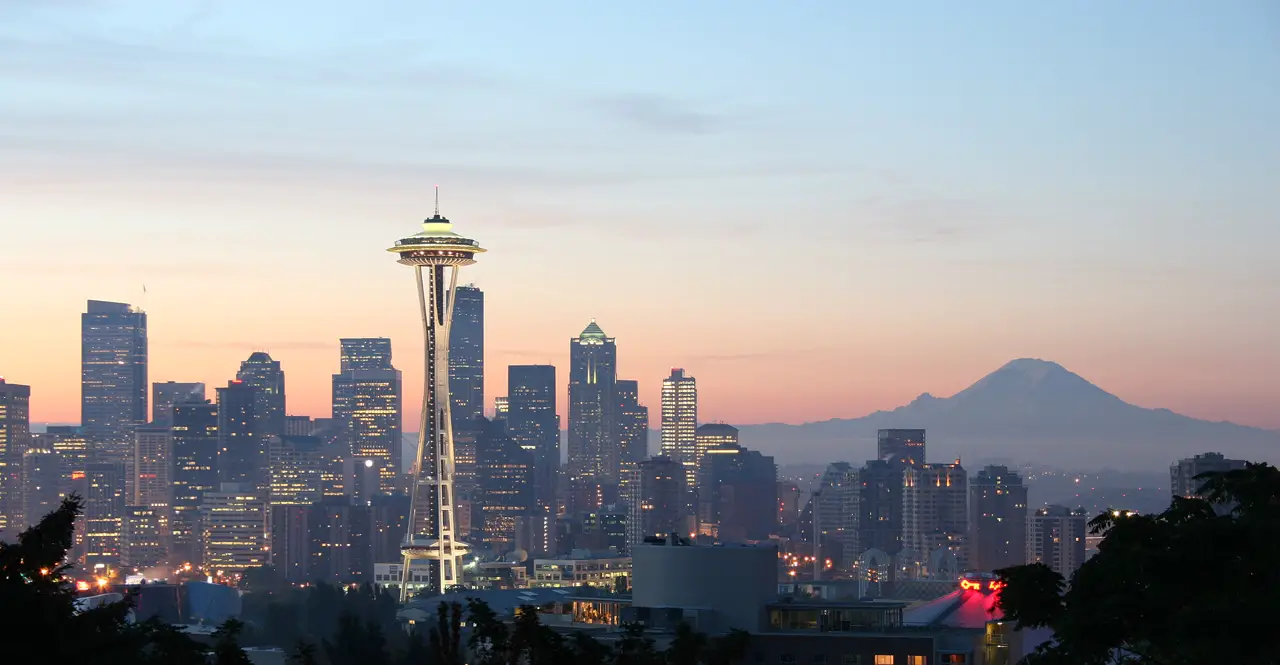
Rank Last Year: 1 (No Change)
Population: 741,440.0
Population 2010: 595,240
Growth: 24.6%
More on Seattle: Data | Real Estate

/10
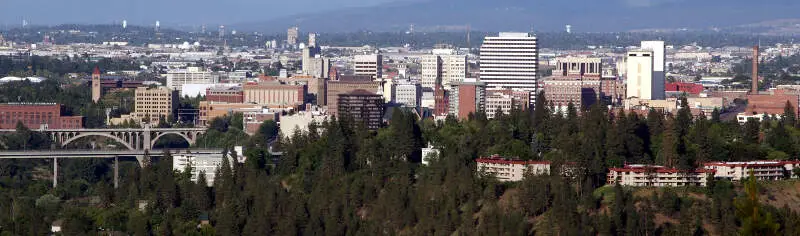
Rank Last Year: 2 (No Change)
Population: 229,228.0
Population 2010: 206,541
Growth: 11.0%
More on Spokane: Data | Real Estate

/10
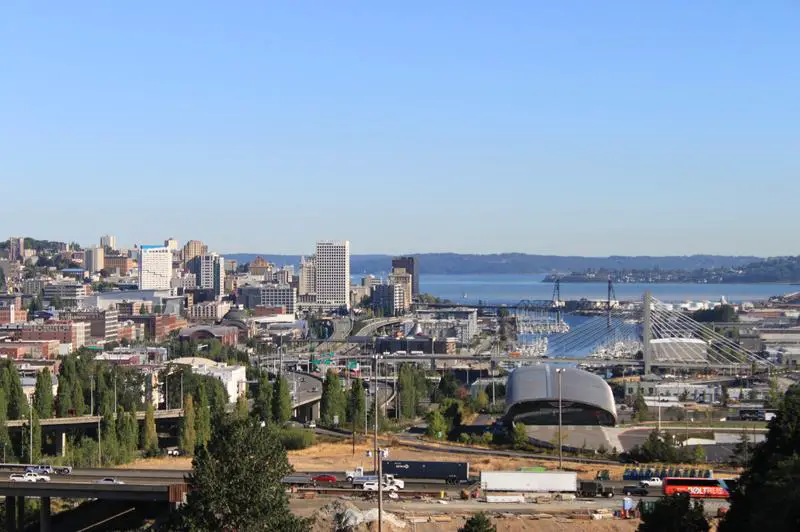
Rank Last Year: 3 (No Change)
Population: 220,482.0
Population 2010: 198,819
Growth: 10.9%
More on Tacoma: Data | Real Estate

/10
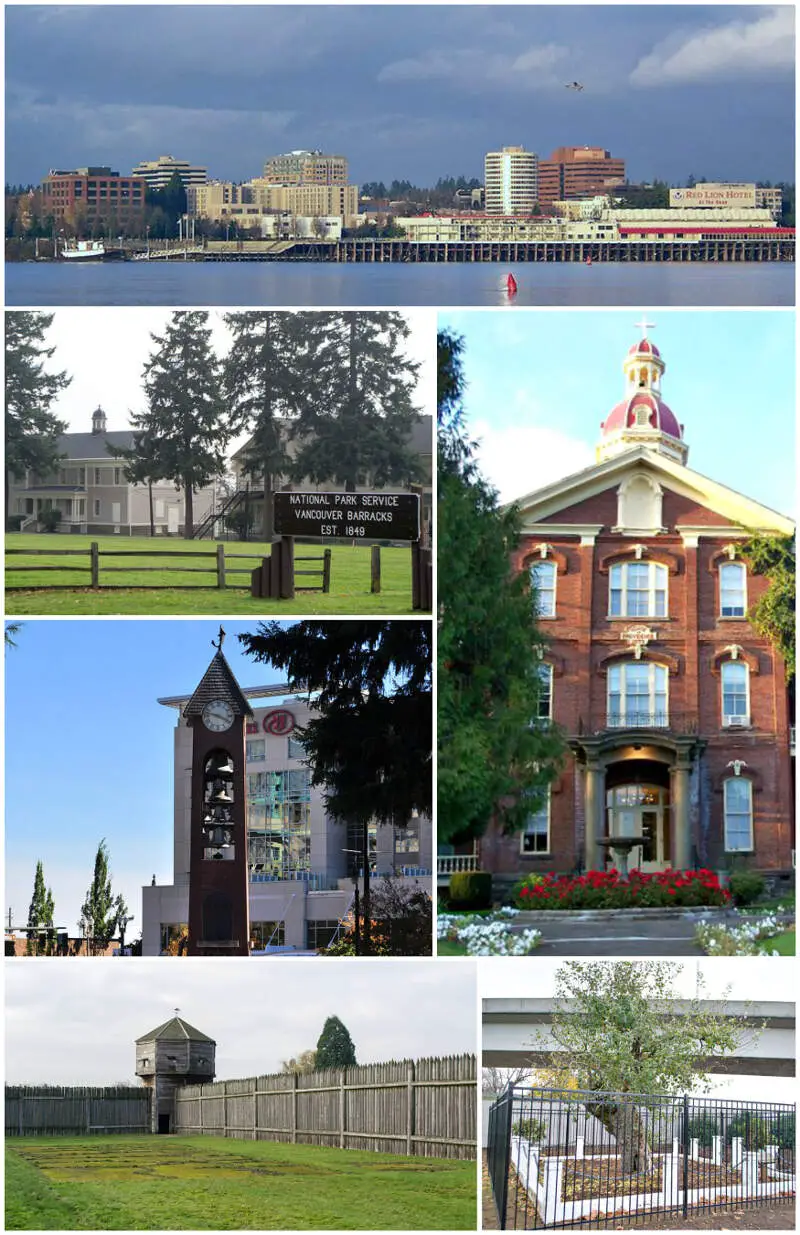
Rank Last Year: 4 (No Change)
Population: 192,696.0
Population 2010: 160,202
Growth: 20.3%
More on Vancouver: Data | Real Estate

/10
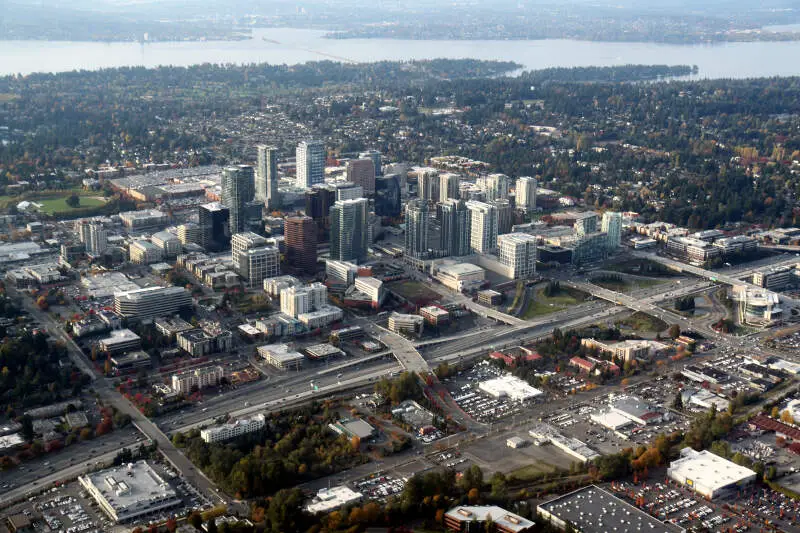
Rank Last Year: 5 (No Change)
Population: 151,199.0
Population 2010: 119,454
Growth: 26.6%
More on Bellevue: Data | Real Estate

/10
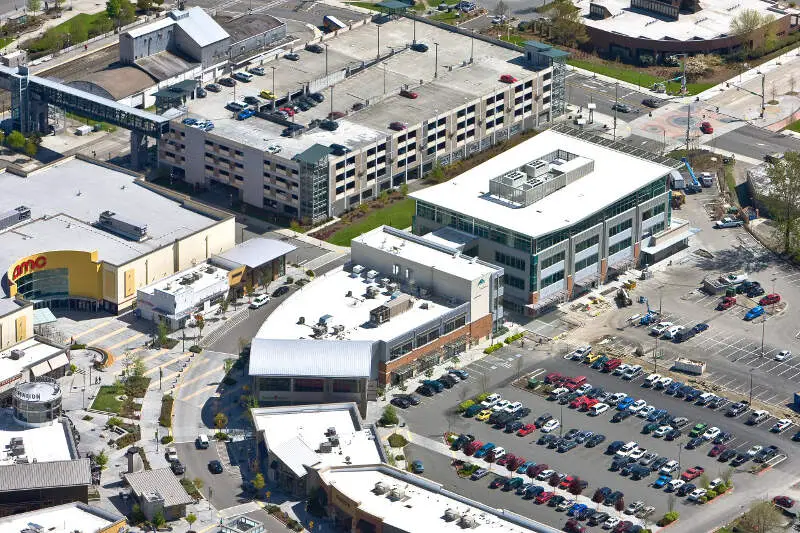
Rank Last Year: 6 (No Change)
Population: 135,015.0
Population 2010: 89,446
Growth: 50.9%
More on Kent: Data | Real Estate

/10
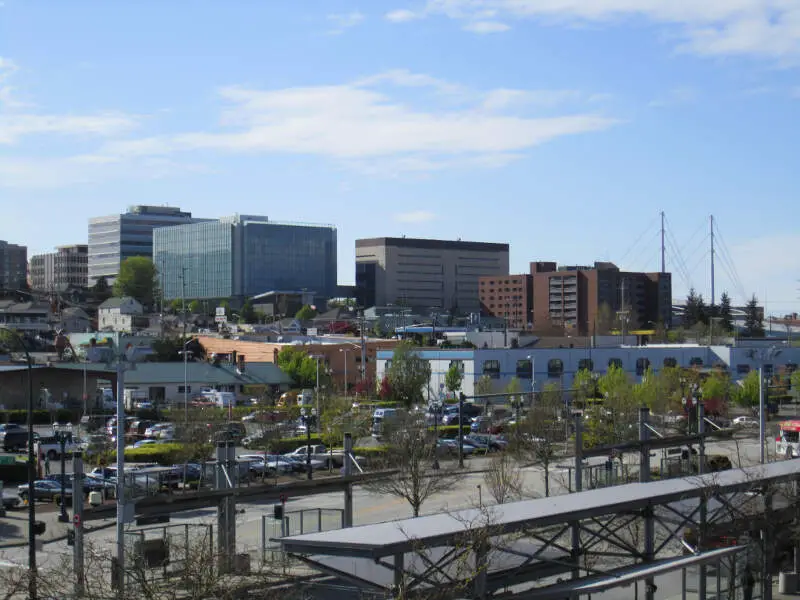
Rank Last Year: 7 (No Change)
Population: 111,083.0
Population 2010: 101,667
Growth: 9.3%
More on Everett: Data | Real Estate

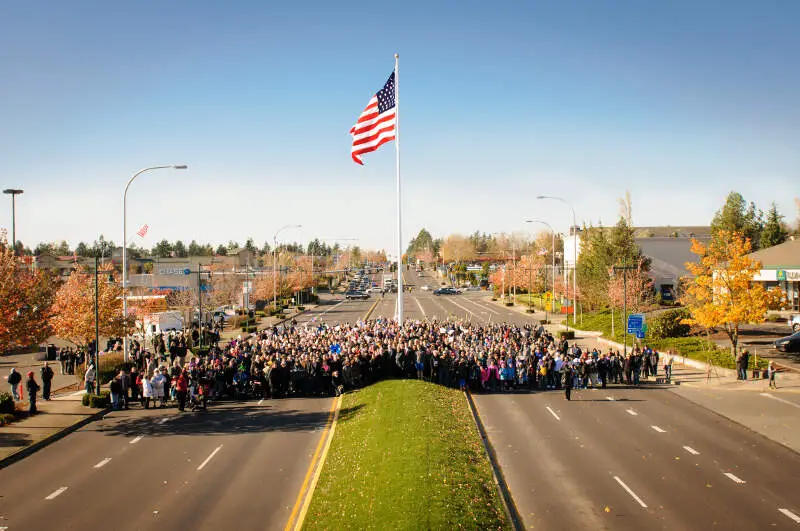
/10
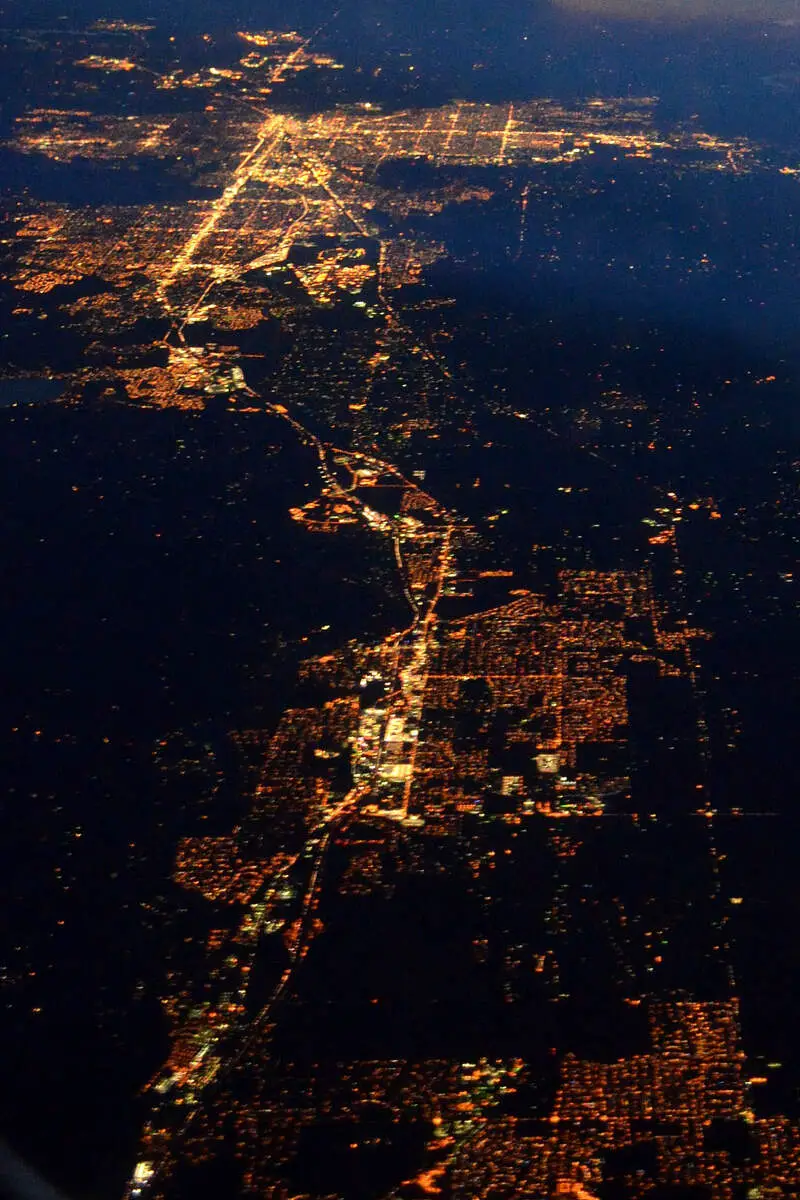
Rank Last Year: 9 (Up 1)
Population: 105,460.0
Population 2010: 88,100
Growth: 19.7%
More on Spokane Valley: Data | Real Estate

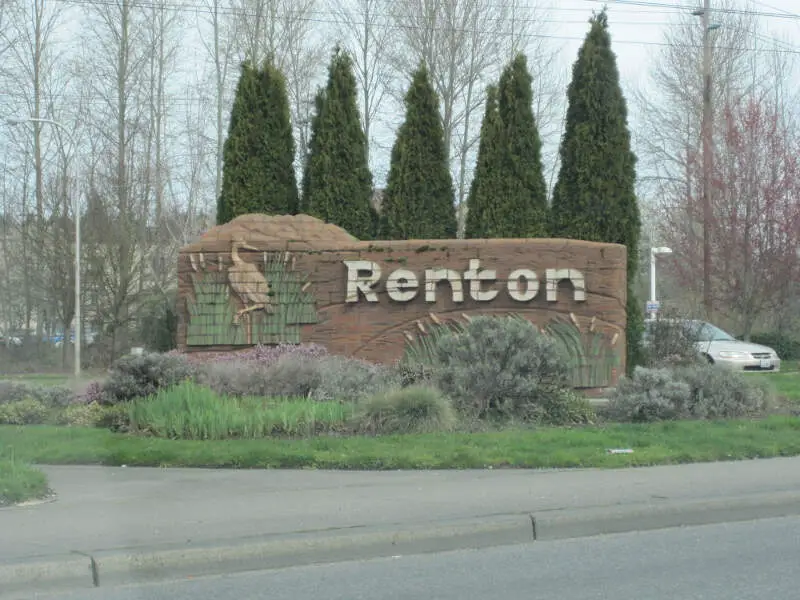
/10
Rank Last Year: 8 (Down 1)
Population: 105,279.0
Population 2010: 86,372
Growth: 21.9%
More on Renton: Data | Real Estate

/10
Rank Last Year: 10 (No Change)
Population: 99,232.0
Population 2010: 87,792
Growth: 13.0%
More on Federal Way: Data | Real Estate
How We Determined The Largest Cities In Washington
We've been ranking and dissecting cities in the Evergreen State for over 4 years now -- making this actually the fourth time we've run the numbers. We always use the best data, the US Census. In this case, that means we are using the American Community Survey.
It what is probably the most simple analysis we run each year, we ranked every place in Washington from biggest to smallest. The biggest city this year? That would be Seattle.
The smallest? Asotin, although there are places smaller than 1,000 people not listed here, so keep that in mind as we take a look at the top ten.
Now on to numbers 11-100 Biggest in Washington
We hope that you find the big city, or really any city, that's right for you. Below is a list of the rest of the biggest cities along with every other place in Washington.
Have fun snacking around in the Evergreen State!
For more reading on Washington, check out:
- Best Places To Raise A Family In Washington
- Best Places To Retire In Washington
- Richest Cities In Washington
- Safest Places In Washington
- Worst Places To Live In Washington
- Most Expensive Places To Live In Washington
Detailed List Of The Biggest Cities In Washington
| Rank | City | Current Population | 2010 | Growth | |||||
|---|---|---|---|---|---|---|---|---|---|
| 1 | Seattle | 741,440.0 | 595,240 | 24.6% | |||||
| 2 | Spokane | 229,228.0 | 206,541 | 11.0% | |||||
| 3 | Tacoma | 220,482.0 | 198,819 | 10.9% | |||||
| 4 | Vancouver | 192,696.0 | 160,202 | 20.3% | |||||
| 5 | Bellevue | 151,199.0 | 119,454 | 26.6% | |||||
| 6 | Kent | 135,015.0 | 89,446 | 50.9% | |||||
| 7 | Everett | 111,083.0 | 101,667 | 9.3% | |||||
| 8 | Spokane Valley | 105,460.0 | 88,100 | 19.7% | |||||
| 9 | Renton | 105,279.0 | 86,372 | 21.9% | |||||
| 10 | Federal Way | 99,232.0 | 87,792 | 13.0% | |||||
| 11 | Yakima | 96,810.0 | 88,630 | 9.2% | |||||
| 12 | Bellingham | 92,367.0 | 78,989 | 16.9% | |||||
| 13 | Kirkland | 91,614.0 | 47,677 | 92.2% | |||||
| 14 | Auburn | 85,455.0 | 66,985 | 27.6% | |||||
| 15 | Kennewick | 84,389.0 | 70,341 | 20.0% | |||||
| 16 | Pasco | 78,446.0 | 54,116 | 45.0% | |||||
| 17 | Redmond | 75,721.0 | 52,124 | 45.3% | |||||
| 18 | Marysville | 71,570.0 | 57,855 | 23.7% | |||||
| 19 | South Hill | 68,161.0 | 52,476 | 29.9% | |||||
| 20 | Sammamish | 66,375.0 | 43,341 | 53.1% | |||||
| 21 | Lakewood | 63,034.0 | 58,700 | 7.4% | |||||
| 22 | Richland | 61,912.0 | 45,780 | 35.2% | |||||
| 23 | Shoreline | 59,280.0 | 52,529 | 12.9% | |||||
| 24 | Lacey | 57,088.0 | 40,334 | 41.5% | |||||
| 25 | Olympia | 55,583.0 | 45,708 | 21.6% | |||||
| 26 | Burien | 51,331.0 | 32,743 | 56.8% | |||||
| 27 | Bothell | 48,610.0 | 32,658 | 48.8% | |||||
| 28 | Bremerton | 44,531.0 | 37,689 | 18.2% | |||||
| 29 | Edmonds | 42,783.0 | 39,682 | 7.8% | |||||
| 30 | Puyallup | 42,642.0 | 36,703 | 16.2% | |||||
| 31 | Lynnwood | 40,953.0 | 35,529 | 15.3% | |||||
| 32 | Lake Stevens | 39,500.0 | 26,902 | 46.8% | |||||
| 33 | Issaquah | 39,472.0 | 27,838 | 41.8% | |||||
| 34 | Parkland | 39,174.0 | 35,413 | 10.6% | |||||
| 35 | Longview | 37,836.0 | 36,605 | 3.4% | |||||
| 36 | Wenatchee | 35,502.0 | 31,173 | 13.9% | |||||
| 37 | Mount Vernon | 35,312.0 | 31,044 | 13.7% | |||||
| 38 | Graham | 35,090.0 | 21,713 | 61.6% | |||||
| 39 | University Place | 34,850.0 | 31,082 | 12.1% | |||||
| 40 | Spanaway | 34,322.0 | 28,054 | 22.3% | |||||
| 41 | Walla Walla | 33,766.0 | 31,177 | 8.3% | |||||
| 42 | Des Moines | 32,545.0 | 29,401 | 10.7% | |||||
| 43 | Pullman | 31,939.0 | 28,655 | 11.5% | |||||
| 44 | Seatac | 31,143.0 | 26,433 | 17.8% | |||||
| 45 | Orchards | 29,716.0 | 20,255 | 46.7% | |||||
| 46 | Maple Valley | 28,121.0 | 20,974 | 34.1% | |||||
| 47 | Camas | 26,779.0 | 18,348 | 46.0% | |||||
| 48 | Tumwater | 26,519.0 | 16,834 | 57.5% | |||||
| 49 | Moses Lake | 25,594.0 | 19,150 | 33.7% | |||||
| 50 | Mill Creek East | 25,461.0 | 14,058 | 81.1% | |||||
| 51 | Mercer Island | 25,282.0 | 22,376 | 13.0% | |||||
| 52 | Bainbridge Island | 24,607.0 | 22,486 | 9.4% | |||||
| 53 | Oak Harbor | 24,396.0 | 22,017 | 10.8% | |||||
| 54 | Frederickson | 24,219.0 | 17,704 | 36.8% | |||||
| 55 | North Lynnwood | 23,653.0 | 15,887 | 48.9% | |||||
| 56 | Kenmore | 23,594.0 | 19,947 | 18.3% | |||||
| 57 | Eastmont | 23,486.0 | 19,355 | 21.3% | |||||
| 58 | Union Hill-Novelty Hill | 23,272.0 | 18,354 | 26.8% | |||||
| 59 | Cottage Lake | 23,170.0 | 22,232 | 4.2% | |||||
| 60 | Hazel Dell | 23,086.0 | 19,287 | 19.7% | |||||
| 61 | Bonney Lake | 22,776.0 | 16,408 | 38.8% | |||||
| 62 | Martha Lake | 22,740.0 | 15,635 | 45.4% | |||||
| 63 | Silver Firs | 21,796.0 | 21,706 | 0.4% | |||||
| 64 | Tukwila | 21,479.0 | 18,567 | 15.7% | |||||
| 65 | Five Corners | 21,444.0 | 17,436 | 23.0% | |||||
| 66 | Mountlake Terrace | 21,419.0 | 19,998 | 7.1% | |||||
| 67 | Mukilteo | 21,312.0 | 19,847 | 7.4% | |||||
| 68 | Battle Ground | 21,293.0 | 16,337 | 30.3% | |||||
| 69 | Silverdale | 21,046.0 | 18,837 | 11.7% | |||||
| 70 | Bothell West | 21,014.0 | 15,607 | 34.6% | |||||
| 71 | Covington | 20,957.0 | 16,814 | 24.6% | |||||
| 72 | Mill Creek | 20,846.0 | 17,485 | 19.2% | |||||
| 73 | Arlington | 20,599.0 | 16,913 | 21.8% | |||||
| 74 | Port Angeles | 20,087.0 | 19,073 | 5.3% | |||||
| 75 | Monroe | 19,696.0 | 16,695 | 18.0% | |||||
| 76 | Salmon Creek | 19,594.0 | 20,037 | -2.2% | |||||
| 77 | Ellensburg | 18,913.0 | 17,847 | 6.0% | |||||
| 78 | Centralia | 18,457.0 | 16,168 | 14.2% | |||||
| 79 | Anacortes | 17,837.0 | 15,668 | 13.8% | |||||
| 80 | Bryn Mawr-Skyway | 17,577.0 | 14,321 | 22.7% | |||||
| 81 | Camano | 17,535.0 | 0 | nan% | |||||
| 82 | West Richland | 17,126.0 | 11,037 | 55.2% | |||||
| 83 | Aberdeen | 17,040.0 | 16,882 | 0.9% | |||||
| 84 | Washougal | 16,945.0 | 13,223 | 28.1% | |||||
| 85 | Port Orchard | 16,398.0 | 10,734 | 52.8% | |||||
| 86 | Sunnyside | 16,329.0 | 15,350 | 6.4% | |||||
| 87 | Lynden | 16,025.0 | 11,580 | 38.4% | |||||
| 88 | Lake Stickney | 15,514.0 | 7,363 | 110.7% | |||||
| 89 | Ferndale | 15,447.0 | 10,993 | 40.5% | |||||
| 90 | White Center | 15,017.0 | 12,658 | 18.6% | |||||
| 91 | Lakeland North | 14,664.0 | 12,192 | 20.3% | |||||
| 92 | Bothell East | 14,487.0 | 6,787 | 113.5% | |||||
| 93 | East Wenatchee | 14,114.0 | 12,844 | 9.9% | |||||
| 94 | Artondale | 14,051.0 | 11,353 | 23.8% | |||||
| 95 | Fort Lewis | 13,983.0 | 13,690 | 2.1% | |||||
| 96 | Elk Plain | 13,863.0 | 14,266 | -2.8% | |||||
| 97 | Snoqualmie | 13,750.0 | 9,058 | 51.8% | |||||
| 98 | Woodinville | 13,440.0 | 10,651 | 26.2% | |||||
| 99 | Lake Forest Park | 13,356.0 | 12,586 | 6.1% | |||||
| 100 | Newcastle | 12,945.0 | 9,868 | 31.2% | |||||
| 101 | Lakeland South | 12,869.0 | 11,219 | 14.7% | |||||
| 102 | Cheney | 12,830.0 | 10,283 | 24.8% | |||||
| 103 | Kelso | 12,697.0 | 11,977 | 6.0% | |||||
| 104 | Edgewood | 12,683.0 | 9,369 | 35.4% | |||||
| 105 | Enumclaw | 12,663.0 | 10,659 | 18.8% | |||||
| 106 | Sedro-Woolley | 12,633.0 | 10,320 | 22.4% | |||||
| 107 | Ridgefield | 12,576.0 | 4,364 | 188.2% | |||||
| 108 | Liberty Lake | 12,435.0 | 6,835 | 81.9% | |||||
| 109 | Lake Tapps | 12,360.0 | 11,274 | 9.6% | |||||
| 110 | East Renton Highlands | 12,241.0 | 11,039 | 10.9% | |||||
| 111 | Gig Harbor | 12,202.0 | 7,102 | 71.8% | |||||
| 112 | Minnehaha | 12,080.0 | 9,641 | 25.3% | |||||
| 113 | Prairie Ridge | 12,054.0 | 11,612 | 3.8% | |||||
| 114 | Poulsbo | 11,962.0 | 8,795 | 36.0% | |||||
| 115 | Birch Bay | 11,103.0 | 7,881 | 40.9% | |||||
| 116 | Grandview | 11,042.0 | 10,391 | 6.3% | |||||
| 117 | Fife | 10,902.0 | 8,434 | 29.3% | |||||
| 118 | Maltby | 10,859.0 | 11,664 | -6.9% | |||||
| 119 | Airway Heights | 10,766.0 | 5,819 | 85.0% | |||||
| 120 | Felida | 10,695.0 | 7,463 | 43.3% | |||||
| 121 | Sumner | 10,674.0 | 9,325 | 14.5% | |||||
| 122 | Mount Vista | 10,635.0 | 7,201 | 47.7% | |||||
| 123 | Shelton | 10,619.0 | 9,699 | 9.5% | |||||
| 124 | Yelm | 10,618.0 | 6,186 | 71.6% | |||||
| 125 | Lake Morton-Berrydale | 10,591.0 | 9,691 | 9.3% | |||||
| 126 | Vashon | 10,424.0 | 9,927 | 5.0% | |||||
| 127 | Port Townsend | 10,290.0 | 9,074 | 13.4% | |||||
| 128 | Snohomish | 10,177.0 | 9,047 | 12.5% | |||||
| 129 | Alderwood Manor | 10,168.0 | 7,898 | 28.7% | |||||
| 130 | Dupont | 9,952.0 | 7,141 | 39.4% | |||||
| 131 | Picnic Point | 9,833.0 | 8,509 | 15.6% | |||||
| 132 | College Place | 9,828.0 | 8,502 | 15.6% | |||||
| 133 | Burlington | 9,637.0 | 8,171 | 17.9% | |||||
| 134 | Terrace Heights | 9,480.0 | 6,679 | 41.9% | |||||
| 135 | Summit View | 9,014.0 | 6,863 | 31.3% | |||||
| 136 | Orting | 8,957.0 | 6,276 | 42.7% | |||||
| 137 | Summit | 8,885.0 | 7,932 | 12.0% | |||||
| 138 | Hoquiam | 8,792.0 | 8,812 | -0.2% | |||||
| 139 | Milton | 8,747.0 | 6,737 | 29.8% | |||||
| 140 | Toppenish | 8,746.0 | 8,820 | -0.8% | |||||
| 141 | Othello | 8,699.0 | 6,919 | 25.7% | |||||
| 142 | Midland | 8,676.0 | 9,612 | -9.7% | |||||
| 143 | Ephrata | 8,493.0 | 7,407 | 14.7% | |||||
| 144 | Stanwood | 8,351.0 | 5,876 | 42.1% | |||||
| 145 | Selah | 8,301.0 | 6,899 | 20.3% | |||||
| 146 | Duvall | 8,279.0 | 6,271 | 32.0% | |||||
| 147 | Barberton | 8,213.0 | 5,107 | 60.8% | |||||
| 148 | Sequim | 8,130.0 | 6,273 | 29.6% | |||||
| 149 | Quincy | 7,922.0 | 6,345 | 24.9% | |||||
| 150 | Waller | 7,857.0 | 7,301 | 7.6% | |||||
| 151 | North Bend | 7,745.0 | 5,688 | 36.2% | |||||
| 152 | Chehalis | 7,536.0 | 7,253 | 3.9% | |||||
| 153 | Clarkston | 7,240.0 | 7,204 | 0.5% | |||||
| 154 | Mead | 7,184.0 | 7,069 | 1.6% | |||||
| 155 | Clarkston Heights-Vineland | 7,144.0 | 6,409 | 11.5% | |||||
| 156 | Clover Creek | 7,128.0 | 6,725 | 6.0% | |||||
| 157 | Fircrest | 7,082.0 | 6,400 | 10.7% | |||||
| 158 | Ocean Shores | 7,076.0 | 5,260 | 34.5% | |||||
| 159 | Pacific | 7,064.0 | 6,455 | 9.4% | |||||
| 160 | Woods Creek | 7,027.0 | 6,047 | 16.2% | |||||
| 161 | Parkwood | 6,976.0 | 7,015 | -0.6% | |||||
| 162 | Sudden Valley | 6,963.0 | 6,713 | 3.7% | |||||
| 163 | Wollochet | 6,905.0 | 6,462 | 6.9% | |||||
| 164 | Hobart | 6,841.0 | 6,337 | 8.0% | |||||
| 165 | Tanglewilde | 6,822.0 | 5,803 | 17.6% | |||||
| 166 | Steilacoom | 6,683.0 | 6,099 | 9.6% | |||||
| 167 | Normandy Park | 6,659.0 | 6,281 | 6.0% | |||||
| 168 | Lake Shore | 6,601.0 | 6,685 | -1.3% | |||||
| 169 | Woodland | 6,513.0 | 5,271 | 23.6% | |||||
| 170 | Union Gap | 6,511.0 | 5,893 | 10.5% | |||||
| 171 | Brier | 6,507.0 | 6,133 | 6.1% | |||||
| 172 | Prosser | 6,213.0 | 5,471 | 13.6% | |||||
| 173 | Rochester | 6,025.0 | 2,007 | 200.2% | |||||
| 174 | Manchester | 6,018.0 | 5,000 | 20.4% | |||||
| 175 | Hockinson | 5,993.0 | 4,590 | 30.6% | |||||
| 176 | North Fort Lewis | 5,990.0 | 2,908 | 106.0% | |||||
| 177 | Blaine | 5,982.0 | 4,550 | 31.5% | |||||
| 178 | Country Homes | 5,979.0 | 5,225 | 14.4% | |||||
| 179 | Bangor Base | 5,931.0 | 4,168 | 42.3% | |||||
| 180 | Sultan | 5,770.0 | 4,416 | 30.7% | |||||
| 181 | Maplewood | 5,766.0 | 5,105 | 12.9% | |||||
| 182 | Finley | 5,734.0 | 5,489 | 4.5% | |||||
| 183 | Lake Goodwin | 5,682.0 | 0 | nan% | |||||
| 184 | West Clarkston-Highland | 5,678.0 | 5,429 | 4.6% | |||||
| 185 | Black Diamond | 5,678.0 | 4,073 | 39.4% | |||||
| 186 | Tracyton | 5,658.0 | 4,728 | 19.7% | |||||
| 187 | East Port Orchard | 5,581.0 | 5,742 | -2.8% | |||||
| 188 | Otis Orchards-East Farms | 5,486.0 | 5,561 | -1.3% | |||||
| 189 | Town And Country | 5,398.0 | 4,885 | 10.5% | |||||
| 190 | Buckley | 5,306.0 | 4,362 | 21.6% | |||||
| 191 | Connell | 5,080.0 | 3,570 | 42.3% | |||||
| 192 | Chain Lake | 4,989.0 | 4,220 | 18.2% | |||||
| 193 | Colville | 4,979.0 | 4,744 | 5.0% | |||||
| 194 | Omak | 4,931.0 | 4,762 | 3.5% | |||||
| 195 | Medical Lake | 4,927.0 | 4,828 | 2.1% | |||||
| 196 | Wauna | 4,831.0 | 3,882 | 24.4% | |||||
| 197 | Venersborg | 4,827.0 | 3,693 | 30.7% | |||||
| 198 | Prairie Heights | 4,817.0 | 4,164 | 15.7% | |||||
| 199 | Longbranch | 4,715.0 | 3,453 | 36.5% | |||||
| 200 | Moses Lake North | 4,693.0 | 4,753 | -1.3% | |||||
| 201 | Granite Falls | 4,658.0 | 3,206 | 45.3% | |||||
| 202 | Deer Park | 4,605.0 | 3,542 | 30.0% | |||||
| 203 | Belfair | 4,601.0 | 3,199 | 43.8% | |||||
| 204 | Wapato | 4,577.0 | 4,868 | -6.0% | |||||
| 205 | Moxee | 4,545.0 | 2,846 | 59.7% | |||||
| 206 | Suquamish | 4,515.0 | 3,857 | 17.1% | |||||
| 207 | Longview Heights | 4,403.0 | 3,473 | 26.8% | |||||
| 208 | Boulevard Park | 4,334.0 | 6,290 | -31.1% | |||||
| 209 | Chelan | 4,314.0 | 3,850 | 12.1% | |||||
| 210 | Bethel | 4,276.0 | 3,334 | 28.3% | |||||
| 211 | Rosedale | 4,267.0 | 3,518 | 21.3% | |||||
| 212 | Mirrormont | 4,217.0 | 3,917 | 7.7% | |||||
| 213 | Montesano | 4,157.0 | 3,924 | 5.9% | |||||
| 214 | Larch Way | 4,046.0 | 3,568 | 13.4% | |||||
| 215 | Esperance | 3,988.0 | 3,381 | 18.0% | |||||
| 216 | La Center | 3,885.0 | 2,637 | 47.3% | |||||
| 217 | Cascade Valley | 3,824.0 | 2,745 | 39.3% | |||||
| 218 | Bunk Foss | 3,718.0 | 3,799 | -2.1% | |||||
| 219 | Grand Mound | 3,711.0 | 2,128 | 74.4% | |||||
| 220 | Port Hadlock-Irondale | 3,695.0 | 3,990 | -7.4% | |||||
| 221 | Maple Heights-Lake Desire | 3,694.0 | 2,997 | 23.3% | |||||
| 222 | Sunnyslope | 3,674.0 | 3,452 | 6.4% | |||||
| 223 | Lake Holm | 3,664.0 | 3,329 | 10.1% | |||||
| 224 | Granger | 3,658.0 | 3,094 | 18.2% | |||||
| 225 | Burbank | 3,645.0 | 3,578 | 1.9% | |||||
| 226 | Key Center | 3,619.0 | 3,003 | 20.5% | |||||
| 227 | Ahtanum | 3,570.0 | 3,866 | -7.7% | |||||
| 228 | Marietta-Alderwood | 3,569.0 | 4,132 | -13.6% | |||||
| 229 | Benton City | 3,559.0 | 2,925 | 21.7% | |||||
| 230 | Canyon Creek | 3,556.0 | 2,815 | 26.3% | |||||
| 231 | Mattawa | 3,553.0 | 0 | nan% | |||||
| 232 | Hansville | 3,533.0 | 2,564 | 37.8% | |||||
| 233 | Indianola | 3,517.0 | 3,174 | 10.8% | |||||
| 234 | Clearview | 3,508.0 | 3,429 | 2.3% | |||||
| 235 | Three Lakes | 3,466.0 | 2,738 | 26.6% | |||||
| 236 | Goldendale | 3,458.0 | 3,468 | -0.3% | |||||
| 237 | Elma | 3,452.0 | 3,117 | 10.7% | |||||
| 238 | Forks | 3,413.0 | 3,509 | -2.7% | |||||
| 239 | Fox Island | 3,365.0 | 2,983 | 12.8% | |||||
| 240 | Lake Cassidy | 3,337.0 | 3,555 | -6.1% | |||||
| 241 | Warm Beach | 3,333.0 | 2,265 | 47.2% | |||||
| 242 | Cashmere | 3,263.0 | 3,033 | 7.6% | |||||
| 243 | Algona | 3,239.0 | 2,875 | 12.7% | |||||
| 244 | Central Park | 3,203.0 | 2,614 | 22.5% | |||||
| 245 | Zillah | 3,163.0 | 2,795 | 13.2% | |||||
| 246 | Raymond | 3,160.0 | 2,930 | 7.8% | |||||
| 247 | High Bridge | 3,147.0 | 2,876 | 9.4% | |||||
| 248 | Gleed | 3,130.0 | 2,548 | 22.8% | |||||
| 249 | Clyde Hill | 3,104.0 | 2,943 | 5.5% | |||||
| 250 | Lochsloy | 3,088.0 | 2,425 | 27.3% | |||||
| 251 | Port Angeles East | 3,035.0 | 3,356 | -9.6% | |||||
| 252 | Fairchild Afb | 3,016.0 | 4,159 | -27.5% | |||||
| 253 | Chico | 3,016.0 | 2,448 | 23.2% | |||||
| 254 | Kalama | 2,996.0 | 2,089 | 43.4% | |||||
| 255 | Arlington Heights | 2,990.0 | 2,082 | 43.6% | |||||
| 256 | Everson | 2,989.0 | 2,565 | 16.5% | |||||
| 257 | Port Ludlow | 2,979.0 | 3,011 | -1.1% | |||||
| 258 | Canterwood | 2,964.0 | 2,666 | 11.2% | |||||
| 259 | Desert Aire | 2,953.0 | 1,196 | 146.9% | |||||
| 260 | Meadowdale | 2,948.0 | 2,839 | 3.8% | |||||
| 261 | Sisco Heights | 2,942.0 | 2,364 | 24.5% | |||||
| 262 | Mcchord Afb | 2,895.0 | 3,124 | -7.3% | |||||
| 263 | Medina | 2,889.0 | 2,947 | -2.0% | |||||
| 264 | Alderton | 2,857.0 | 2,870 | -0.5% | |||||
| 265 | Eatonville | 2,843.0 | 2,640 | 7.7% | |||||
| 266 | Colfax | 2,785.0 | 2,806 | -0.7% | |||||
| 267 | Dayton | 2,695.0 | 2,463 | 9.4% | |||||
| 268 | Friday Harbor | 2,685.0 | 2,367 | 13.4% | |||||
| 269 | Fobes Hill | 2,683.0 | 2,475 | 8.4% | |||||
| 270 | Leavenworth | 2,676.0 | 2,660 | 0.6% | |||||
| 271 | Peaceful Valley | 2,661.0 | 3,220 | -17.4% | |||||
| 272 | Allyn | 2,656.0 | 1,381 | 92.3% | |||||
| 273 | Big Lake | 2,648.0 | 1,753 | 51.1% | |||||
| 274 | Kingston | 2,585.0 | 1,938 | 33.4% | |||||
| 275 | Brush Prairie | 2,563.0 | 2,368 | 8.2% | |||||
| 276 | Carson | 2,553.0 | 2,296 | 11.2% | |||||
| 277 | Chewelah | 2,552.0 | 2,558 | -0.2% | |||||
| 278 | Navy Yard City | 2,542.0 | 2,543 | -0.0% | |||||
| 279 | Meadow Glade | 2,534.0 | 2,197 | 15.3% | |||||
| 280 | White Salmon | 2,533.0 | 2,041 | 24.1% | |||||
| 281 | Warden | 2,531.0 | 2,620 | -3.4% | |||||
| 282 | Burley | 2,516.0 | 2,099 | 19.9% | |||||
| 283 | North Yelm | 2,503.0 | 2,877 | -13.0% | |||||
| 284 | Rainier | 2,499.0 | 1,621 | 54.2% | |||||
| 285 | Mabton | 2,481.0 | 1,688 | 47.0% | |||||
| 286 | Okanogan | 2,477.0 | 2,510 | -1.3% | |||||
| 287 | Carnation | 2,476.0 | 2,081 | 19.0% | |||||
| 288 | Gold Bar | 2,396.0 | 2,464 | -2.8% | |||||
| 289 | Bryant | 2,375.0 | 1,811 | 31.1% | |||||
| 290 | Lewisville | 2,372.0 | 2,031 | 16.8% | |||||
| 291 | Bridgeport | 2,307.0 | 2,773 | -16.8% | |||||
| 292 | Cosmopolis | 2,301.0 | 1,367 | 68.3% | |||||
| 293 | Castle Rock | 2,298.0 | 2,326 | -1.2% | |||||
| 294 | Whidbey Island Station | 2,284.0 | 3,071 | -25.6% | |||||
| 295 | Newport | 2,269.0 | 2,316 | -2.0% | |||||
| 296 | Walla Walla East | 2,264.0 | 1,248 | 81.4% | |||||
| 297 | Mccleary | 2,262.0 | 1,711 | 32.2% | |||||
| 298 | Shadow Lake | 2,221.0 | 1,988 | 11.7% | |||||
| 299 | Geneva | 2,200.0 | 2,442 | -9.9% | |||||
| 300 | Westport | 2,164.0 | 1,866 | 16.0% | |||||
| 301 | Riverbend | 2,150.0 | 2,011 | 6.9% | |||||
| 302 | Enetai | 2,135.0 | 2,189 | -2.5% | |||||
| 303 | Fern Prairie | 2,132.0 | 1,789 | 19.2% | |||||
| 304 | Southworth | 2,109.0 | 2,582 | -18.3% | |||||
| 305 | Cle Elum | 2,078.0 | 2,545 | -18.3% | |||||
| 306 | Monroe North | 2,069.0 | 1,602 | 29.2% | |||||
| 307 | Duluth | 2,040.0 | 1,584 | 28.8% | |||||
| 308 | Summitview | 2,031.0 | 1,059 | 91.8% | |||||
| 309 | Lofall | 2,018.0 | 2,549 | -20.8% | |||||
| 310 | Freeland | 1,966.0 | 1,768 | 11.2% | |||||
| 311 | Tenino | 1,965.0 | 1,862 | 5.5% | |||||
| 312 | Winlock | 1,951.0 | 1,315 | 48.4% | |||||
| 313 | Ritzville | 1,942.0 | 1,921 | 1.1% | |||||
| 314 | Coupeville | 1,934.0 | 1,777 | 8.8% | |||||
| 315 | Tieton | 1,911.0 | 0 | nan% | |||||
| 316 | South Creek | 1,885.0 | 2,513 | -25.0% | |||||
| 317 | Millwood | 1,880.0 | 0 | nan% | |||||
| 318 | Cathcart | 1,878.0 | 2,112 | -11.1% | |||||
| 319 | South Bend | 1,856.0 | 1,817 | 2.1% | |||||
| 320 | Cavalero | 1,850.0 | 4,631 | -60.1% | |||||
| 321 | Long Beach | 1,844.0 | 1,580 | 16.7% | |||||
| 322 | Garrett | 1,824.0 | 1,347 | 35.4% | |||||
| 323 | Davenport | 1,819.0 | 2,081 | -12.6% | |||||
| 324 | Ocean Park | 1,777.0 | 1,609 | 10.4% | |||||
| 325 | Wilderness Rim | 1,770.0 | 1,331 | 33.0% | |||||
| 326 | Fords Prairie | 1,762.0 | 1,902 | -7.4% | |||||
| 327 | Fall City | 1,743.0 | 2,068 | -15.7% | |||||
| 328 | Brewster | 1,737.0 | 2,336 | -25.6% | |||||
| 329 | Home | 1,718.0 | 891 | 92.8% | |||||
| 330 | Napavine | 1,705.0 | 1,658 | 2.8% | |||||
| 331 | Kettle Falls | 1,703.0 | 1,642 | 3.7% | |||||
| 332 | Oroville | 1,686.0 | 1,977 | -14.7% | |||||
| 333 | Stevenson | 1,676.0 | 1,669 | 0.4% | |||||
| 334 | Kayak Point | 1,660.0 | 0 | nan% | |||||
| 335 | Rocky Point | 1,648.0 | 1,391 | 18.5% | |||||
| 336 | Yacolt | 1,628.0 | 1,487 | 9.5% | |||||
| 337 | Royal City | 1,615.0 | 1,607 | 0.5% | |||||
| 338 | Lakeview | 1,601.0 | 727 | 120.2% | |||||
| 339 | Manson | 1,595.0 | 1,296 | 23.1% | |||||
| 340 | Stansberry Lake | 1,574.0 | 1,802 | -12.7% | |||||
| 341 | Nooksack | 1,547.0 | 1,090 | 41.9% | |||||
| 342 | Amboy | 1,545.0 | 1,268 | 21.8% | |||||
| 343 | Basin City | 1,527.0 | 881 | 73.3% | |||||
| 344 | Fife Heights | 1,508.0 | 2,150 | -29.9% | |||||
| 345 | Lake Marcel-Stillwater | 1,463.0 | 1,240 | 18.0% | |||||
| 346 | Coulee Dam | 1,457.0 | 1,224 | 19.0% | |||||
| 347 | Dallesport | 1,434.0 | 1,363 | 5.2% | |||||
| 348 | Pomeroy | 1,423.0 | 1,449 | -1.8% | |||||
| 349 | Ilwaco | 1,418.0 | 1,151 | 23.2% | |||||
| 350 | Darrington | 1,397.0 | 1,437 | -2.8% | |||||
| 351 | Sumas | 1,384.0 | 1,000 | 38.4% | |||||
| 352 | Clinton | 1,367.0 | 1,097 | 24.6% | |||||
| 353 | North Puyallup | 1,363.0 | 1,637 | -16.7% | |||||
| 354 | Waterville | 1,353.0 | 1,154 | 17.2% | |||||
| 355 | Anderson Island | 1,341.0 | 907 | 47.9% | |||||
| 356 | Mcmillin | 1,298.0 | 1,924 | -32.5% | |||||
| 357 | Soap Lake | 1,286.0 | 1,183 | 8.7% | |||||
| 358 | Point Roberts | 1,275.0 | 1,285 | -0.8% | |||||
| 359 | Purdy | 1,222.0 | 1,280 | -4.5% | |||||
| 360 | Sunday Lake | 1,209.0 | 696 | 73.7% | |||||
| 361 | Yarrow Point | 1,192.0 | 854 | 39.6% | |||||
| 362 | Kittitas | 1,186.0 | 1,433 | -17.2% | |||||
| 363 | Woodway | 1,174.0 | 1,421 | -17.4% | |||||
| 364 | Crocker | 1,173.0 | 910 | 28.9% | |||||
| 365 | Swede Heaven | 1,163.0 | 730 | 59.3% | |||||
| 366 | West Pasco | 1,157.0 | 4,081 | -71.6% | |||||
| 367 | North Bonneville | 1,151.0 | 878 | 31.1% | |||||
| 368 | Entiat | 1,151.0 | 1,218 | -5.5% | |||||
| 369 | Morton | 1,142.0 | 1,247 | -8.4% | |||||
| 370 | Rock Island | 1,142.0 | 806 | 41.7% | |||||
| 371 | Ames Lake | 1,138.0 | 1,383 | -17.7% | |||||
| 372 | Puget Island | 1,136.0 | 896 | 26.8% | |||||
| 373 | George | 1,136.0 | 676 | 68.0% | |||||
| 374 | Carlsborg | 1,135.0 | 1,005 | 12.9% | |||||
| 375 | Palouse | 1,131.0 | 955 | 18.4% | |||||
| 376 | Machias | 1,112.0 | 1,079 | 3.1% | |||||
| 377 | Langley | 1,090.0 | 1,050 | 3.8% | |||||
| 378 | Lake Ketchum | 1,088.0 | 619 | 75.8% | |||||
| 379 | South Wenatchee | 1,083.0 | 1,002 | 8.1% | |||||
| 380 | Neah Bay | 1,056.0 | 697 | 51.5% | |||||
| 381 | Easton | 1,046.0 | 528 | 98.1% | |||||
| 382 | Republic | 1,043.0 | 1,345 | -22.5% | |||||
| 383 | Asotin | 1,039.0 | 922 | 12.7% | |||||