There’s liberal media, Liberty Island, Liberty Bell, and liberal cities. But where are the most liberal cities in the United States?
Most lists use vibes to guess which city seems more liberal, but we have Saturday Night Science to back us up. Specifically, we wanted to know the cities in America that have the highest number of liberal voters.
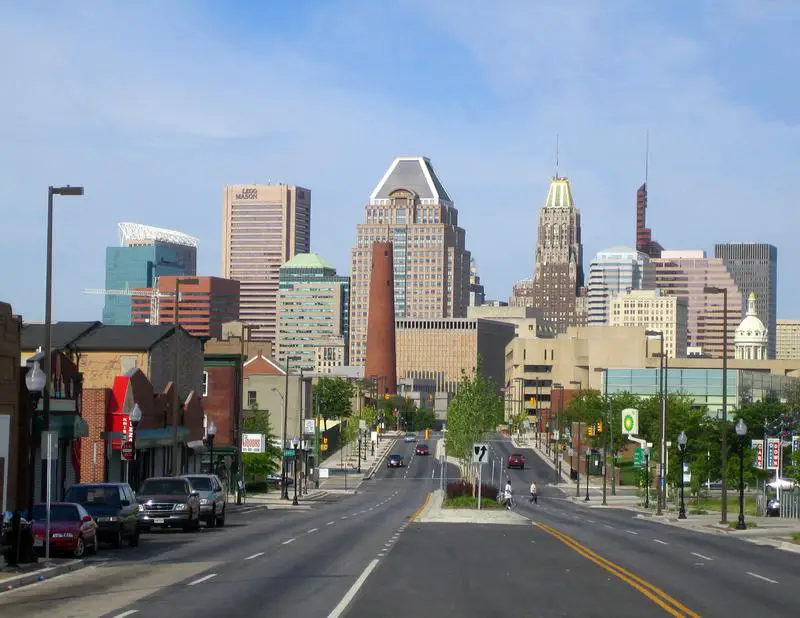
After analyzing the 100 biggest cities in America, it turns out Baltimore is the most liberal city in America — not a huge surprise.
And to be clear, we didn’t form this list based on our own biases — we relied on the cold hard data.
100.0% Democrat
Data | Crime | Cost of living | Movers

100.0% Democrat
Data | Crime | Cost of living | Movers
100.0% Democrat
Data | Crime | Cost of living | Movers
100.0% Democrat
Data | Crime | Cost of living | Movers

100.0% Democrat
Data | Crime | Cost of living | Movers
100.0% Democrat
Data | Crime | Cost of living | Movers

100.0% Democrat
Data | Crime | Cost of living | Movers
100.0% Democrat
Data | Cost of living | Movers
100.0% Democrat
Data | Cost of living | Movers
100.0% Democrat
Data | Crime | Cost of living | Movers
The receipts
Compare the top ten
Pick a metric. The bars rescale. The red line is the United States’s statewide median.
On the map
Where the most liberal cities in America are
Saturday Night Science
How we determined the most liberal cities in America for 2026
Using Saturday Night Science, we created a list of the 100 biggest cities in America based on the 2020-2024 American Community Survey.
We then measured the voting record and MIT election data to determine which places lean the most leftward in their allegiances. We looked at:
Because no centralized database contains voting data at the city level, we used county-level election results from the 2020 election. We assigned every city in a county the percentage of votes that went to the Democrats, effectively extending the county’s results to the city level.
- Percentage Of Votes For Democratic President In 2020
Next, we ranked each city from 1 to 100 for each criterion, where number one was the most liberal. The winner, Baltimore, is “The Most Liberal City in America For 2026”.
We updated this article for 2026. This report is our eleventh time ranking the most liberal cities in America.
The full list
Most Liberal Cities In The United States For 2026
Click any column to sort. Search by city name.
| Rank | City | Population | % Liberal |
|---|---|---|---|
| 1 | Baltimore, MD | 573,243 | 100.0% |
| 2 | San Francisco, CA | 830,235 | 100.0% |
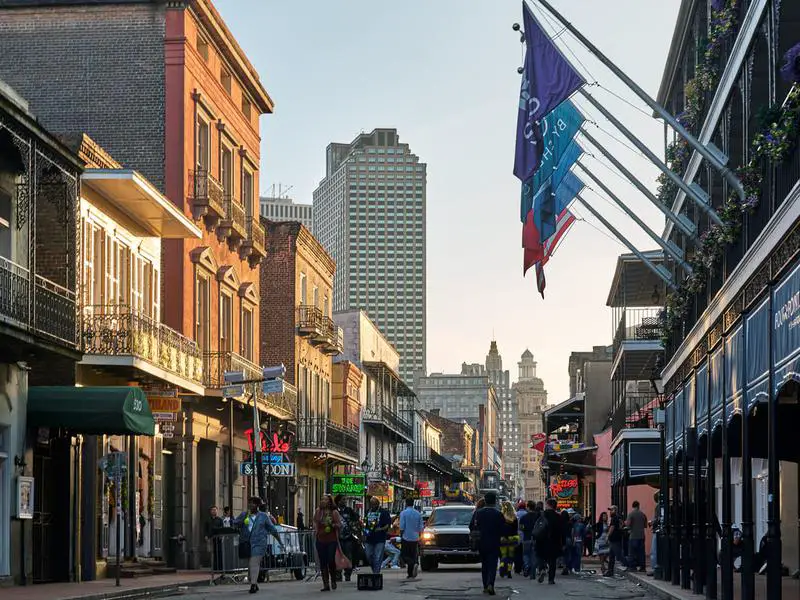
| 3 | New Orleans, LA | 371,853 | 100.0% |
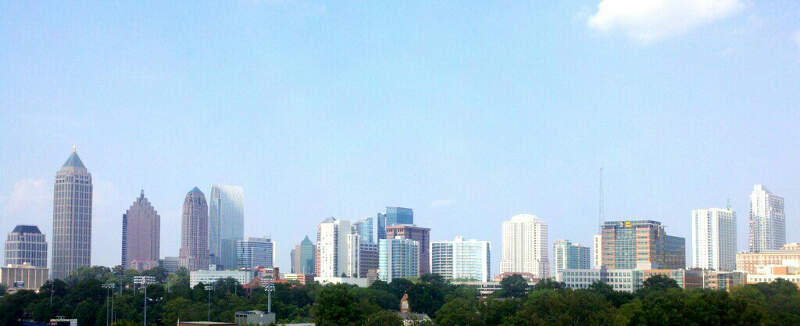
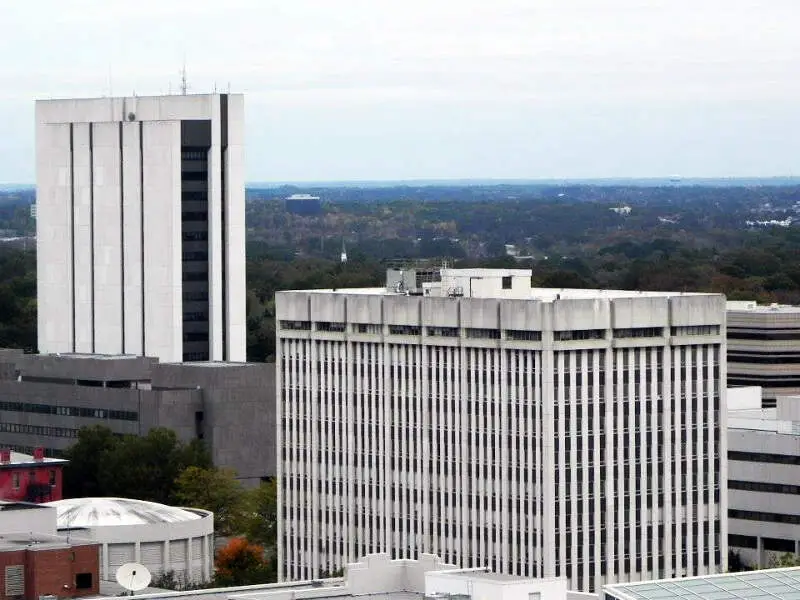
| 4 | Atlanta, GA | 505,268 | 100.0% |
| 5 | Richmond, VA | 229,359 | 100.0% |
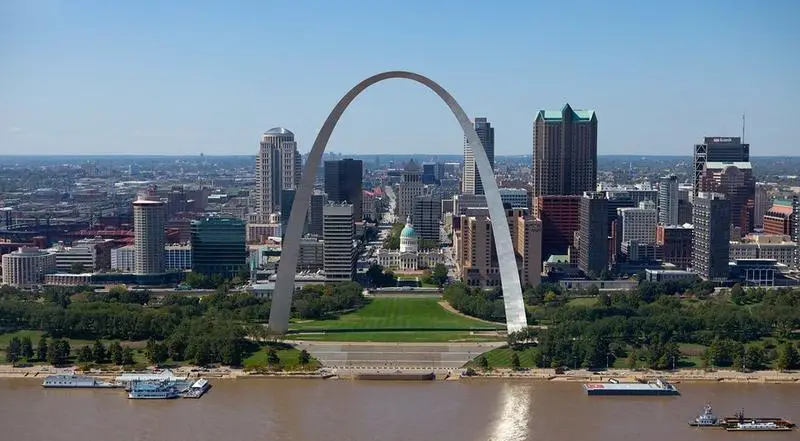
| 6 | St. Louis, MO | 288,512 | 100.0% |
| 7 | New York, NY | 8,483,844 | 100.0% |
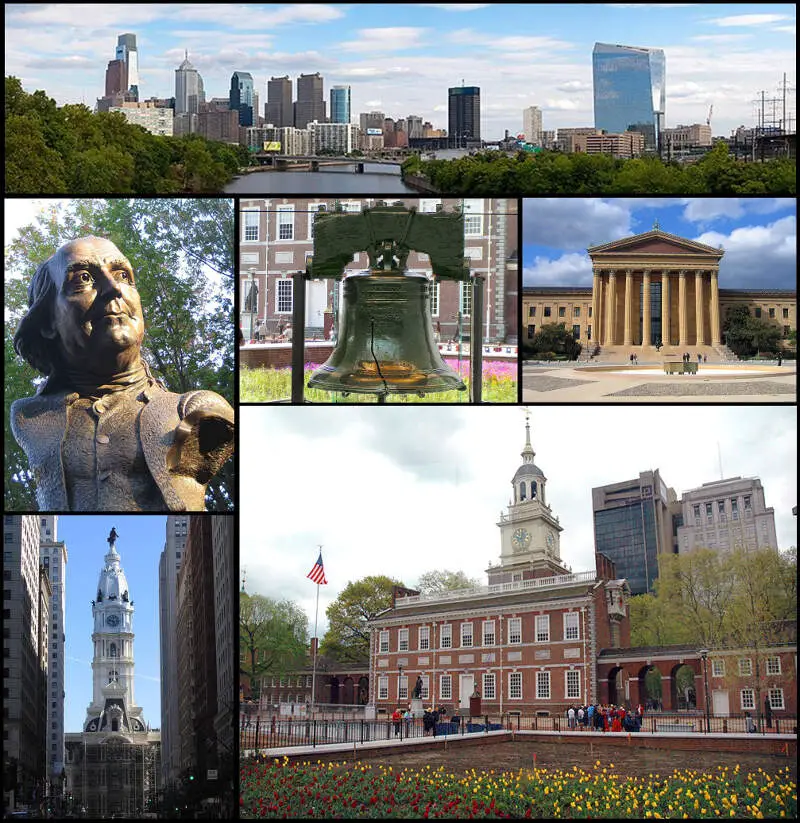
| 8 | Philadelphia, PA | 1,579,706 | 100.0% |
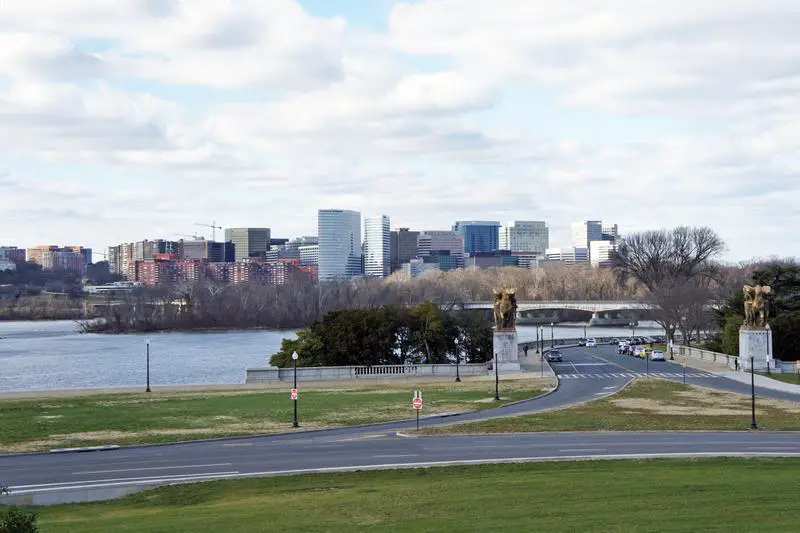
| 9 | Arlington, VA | 236,254 | 100.0% |
| 10 | Raleigh, NC | 481,031 | 100.0% |
| 10 | Durham, NC | 291,467 | 100.0% |
| 12 | Boston, MA | 666,442 | 100.0% |
| 13 | Oakland, CA | 439,418 | 100.0% |
| 13 | Fremont, CA | 228,295 | 100.0% |
| 15 | Denver, CO | 718,877 | 100.0% |
| 16 | Newark, NJ | 310,178 | 100.0% |
| 17 | Madison, WI | 278,001 | 100.0% |
| 18 | Seattle, WA | 754,195 | 100.0% |
| 19 | Chicago, IL | 2,711,226 | 100.0% |
| 20 | San Jose, CA | 990,138 | 100.0% |
| 21 | Jersey City, NJ | 294,078 | 100.0% |
| 22 | Norfolk, VA | 233,596 | 100.0% |
| 23 | St. Paul, MN | 307,284 | 100.0% |
| 25 | Santa Clarita, CA | 230,221 | 100.0% |
| 25 | Long Beach, CA | 455,548 | 100.0% |
| 25 | Los Angeles, CA | 3,857,263 | 100.0% |
| 27 | Minneapolis, MN | 427,246 | 100.0% |
| 28 | Milwaukee, WI | 566,973 | 100.0% |
| 29 | Detroit, MI | 638,530 | 100.0% |
| 30 | El Paso, TX | 680,130 | 100.0% |
| 31 | Charlotte, NC | 903,844 | 100.0% |
| 32 | Cleveland, OH | 366,097 | 100.0% |
| 33 | Irving, TX | 256,492 | 100.0% |
| 34 | Alexander , TN | 690,130 | 100.0% |
| 35 | Memphis, TN | 618,980 | 100.0% |
| 36 | Indianapolis, IN | 885,860 | 100.0% |
| 37 | Urban Honolulu, HI | 345,482 | 100.0% |
| 38 | Sacramento, CA | 528,706 | 100.0% |
| 39 | Laredo, TX | 257,619 | 100.0% |
| 40 | Orlando, FL | 319,758 | 100.0% |
| 41 | Albuquerque, NM | 562,218 | 100.0% |
| 42 | Greensboro, NC | 301,198 | 100.0% |
| 43 | San Diego, CA | 1,389,526 | 100.0% |
| 43 | Chula Vista, CA | 276,375 | 100.0% |
| 45 | Pittsburgh, PA | 304,759 | 100.0% |
| 46 | Lexington-Fayette Urban County, KY | 323,725 | 100.0% |
| 47 | Louisville/Jefferson County Metro Government (Balance), KY | 631,818 | 100.0% |
| 48 | Tucson, AZ | 547,073 | 100.0% |
| 49 | San Antonio, TX | 1,479,835 | 100.0% |
| 50 | Toledo, OH | 267,463 | 100.0% |
| 51 | Cincinnati, OH | 311,224 | 100.0% |
| 52 | Aurora, CO | 394,432 | 100.0% |
| 53 | Winston-Salem, NC | 252,037 | 100.0% |
| 54 | Buffalo, NY | 276,854 | 100.0% |
| 55 | Stockton, CA | 322,326 | 100.0% |
| 56 | Houston, TX | 2,328,253 | 100.0% |
| 57 | Omaha, NE | 488,837 | 100.0% |
| 58 | Austin, TX | 979,539 | 100.0% |
| 59 | Portland, OR | 641,165 | 100.0% |
| 61 | Enterprise, NV | 240,464 | 100.0% |
| 61 | North Las Vegas, NV | 278,595 | 100.0% |
| 61 | Las Vegas, NV | 660,400 | 100.0% |
| 61 | Henderson, NV | 332,141 | 100.0% |
| 65 | Anaheim, CA | 344,521 | 100.0% |
| 65 | Santa Ana, CA | 312,534 | 100.0% |
| 65 | Irvine, CA | 311,690 | 100.0% |
| 67 | Miami, FL | 459,745 | 100.0% |
| 68 | Riverside, CA | 319,069 | 100.0% |
| 69 | Fresno, CA | 545,970 | 100.0% |
| 70 | Tampa, FL | 401,618 | 100.0% |
| 71 | Lincoln, NE | 294,856 | 100.0% |
| 72 | Chesapeake, VA | 252,583 | 100.0% |
| 73 | Virginia Beach, VA | 456,349 | 100.0% |
| 74 | Jacksonville, FL | 977,670 | 100.0% |
| 75 | Reno, NV | 273,212 | 100.0% |
| 78 | Phoenix, AZ | 1,642,323 | 100.0% |
| 78 | Mesa, AZ | 511,764 | 100.0% |
| 78 | Gilbert, AZ | 280,262 | 100.0% |
| 78 | Chandler, AZ | 280,136 | 100.0% |
| 78 | Glendale, AZ | 252,833 | 100.0% |
| 78 | Scottsdale, AZ | 243,821 | 100.0% |
| 82 | St. Petersburg, FL | 262,732 | 0.0% |
| 83 | Arlington, TX | 397,742 | 0.0% |
| 84 | Port St. Lucie, FL | 232,491 | 0.0% |
| 86 | Dallas, TX | 1,307,930 | 0.0% |
| 86 | Plano, TX | 290,594 | 0.0% |
| 86 | Garland, TX | 246,844 | 0.0% |
| 88 | Boise City, ID | 237,242 | 0.0% |
| 89 | Spokane, WA | 230,293 | 0.0% |
| 90 | Columbus, OH | 914,802 | 0.0% |
| 91 | Fort Worth, TX | 963,194 | 0.0% |
| 92 | Bakersfield, CA | 411,986 | 0.0% |
| 93 | Fort Wayne, IN | 268,589 | 0.0% |
| 94 | Wichita, KS | 397,945 | 0.0% |
| 95 | Colorado Springs, CO | 487,887 | 0.0% |
| 96 | Kansas City, MO | 510,612 | 0.0% |
| 97 | Lubbock, TX | 264,814 | 0.0% |
| 98 | Tulsa, OK | 413,794 | 0.0% |
| 99 | Oklahoma City, OK | 697,125 | 0.0% |
| 100 | Corpus Christi, TX | 317,419 | 0.0% |
Source: U.S. Census ACS 2020-2024 + MIT election data. The 100 largest US cities.
Summary
Summing Up All The Liberal Snowflake Cities In The US
Well, there you have it, the big cities in America that have the highest number of liberals per capita, with Baltimore ranking as the least conservative in the entire country.
The most liberal cities in the United States are Baltimore, MD, San Francisco, CA, New Orleans, LA, Atlanta, GA, Richmond, VA, St. Louis, MO, New York, NY, Philadelphia, PA, Arlington, VA, and Raleigh, NC.


