Pennsylvania calls to mind images of rich history and bustling cities like Pittsburgh and, let's not forget, a commitment to safety that equals the stability of its renowned Liberty Bell. In this guide, we will delve into the safest places to live in Pennsylvania, where a strong focus on security meets the charm of the state's picturesque towns and cities.
So, where does Pennsylvania stand on the national crime scale? We've ranked Pennsylvania as the 16th safest state in America. But you must be curious about the safest place to reside within the Keystone State's borders.
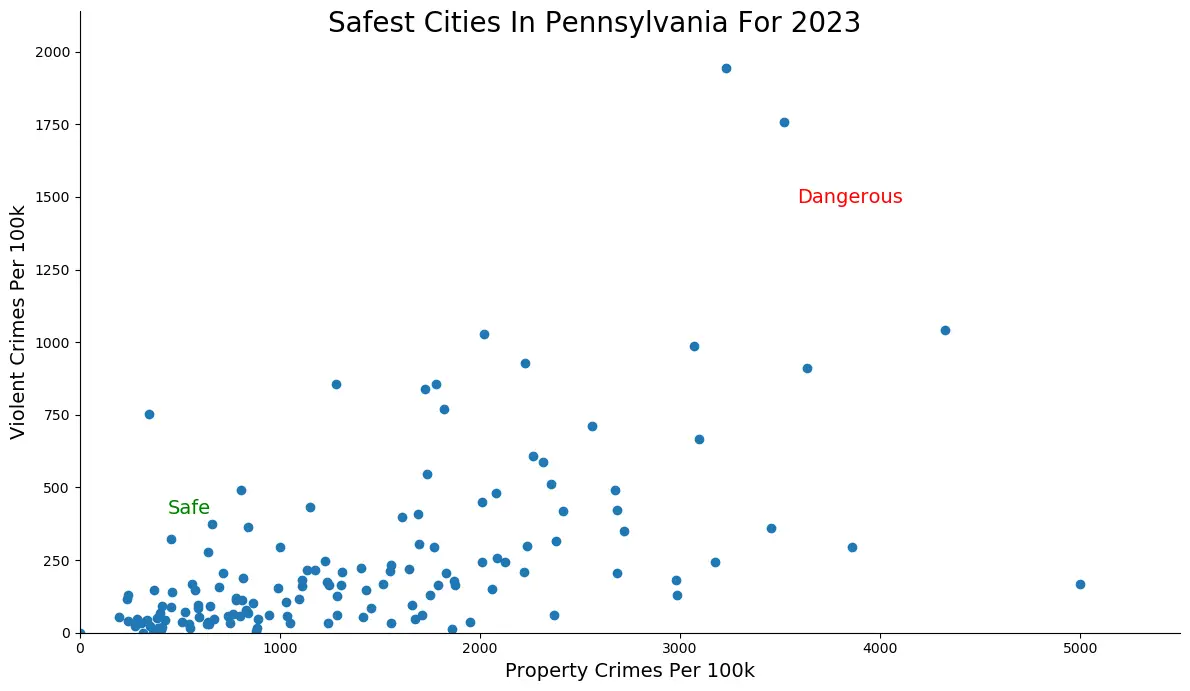
To determine Pennsylvania's safest places, we've relied on the latest FBI Crime data, scrutinizing property and violent crimes per capita.
As we tour the safest places in Pennsylvania, we'll focus on each location's unique appeal and amenities, from the tree-lined boulevards of Philadelphia suburbs to the quintessentially charming squares of small towns. Whether you're a city dweller or prefer the quiet allure of rural landscapes, we have a safe place for you.
0 violent / 0 property per 100k
A part of the State College Metro Area, Bellefonte ranks as the safest city in Pennsylvania with an especially low rate of violent crime. The borough only had one violent crime in 2024. Don't worry about art thieves pulling a heist at the Bellefonte Museum either, because Bellefonte had the second safest rate of property crime in the state.
Add Bellefonte's solid job and housing market to the mix, and you've got a recipe for a great place to live.
Data | Cost of living | Movers
0 violent / 0 property per 100k
Out in the middle of nowhere Pennsylvania, in what you could describe as a Scranton suburb, you'll find Luzerne, the second safest place in Pennsylvania for 2026.
It's hard to find a place less violent or more different than Philly, considering Luzerne recorded 0 violent crimes in the last reporting year -- basically, the way life should be.
On top of that, Luzerne had the second safest lowest property crime rate in Pennsylvania. In other words, there's a better chance of a stray Hersey chocolate breaking your window than a burglar.

0 violent / 37 property per 100k

0 violent / 87 property per 100k
West Vincent Township, one of the safest cities in Pennsylvania, is located off of Pennsylvania Route 100 and 401. Home to notable figures like naturalist Graceanna Lewis and Supreme Court Justice Owen J. Roberts, the township has a rich history. Low crime rates, with 33 violent crimes per 100k and 305 property crimes per 100k, make it a secure haven for those looking to move to Pennsylvania.

0 violent / 103 property per 100k

0 violent / 125 property per 100k

0 violent / 160 property per 100k
0 violent / 182 property per 100k
12 violent / 72 property per 100k
18 violent / 18 property per 100k
The receipts
Compare the top ten
Pick a metric. The bars rescale. The red line is Pennsylvania's statewide median. Lower is safer.
Pennsylvania statewide median: 88
Pennsylvania statewide median: 760
Pennsylvania statewide median: 0
On the map
Where the safety is in Pennsylvania
Saturday Night Science
Methodology: How we calculated the safest cities in Pennsylvania for 2026
While there are surveys and public polls on what cities in Pennsylvania are the safest, we wanted to rely on something other than speculation and opinion. Instead, we looked at the hard numbers from the FBI's most recent crime report in Pennsylvania.
Specifically, we used Saturday Night Science to analyze the FBI's Uniform Crime Report, which summarizes the number of property and violent crimes in each city annually. We used two criteria:
- Violent crimes per capita (murders, assaults, rapes, armed robberies)
- Property crimes per capita (thefts, burglaries, motor vehicle thefts)
For example, there were 0 crimes committed in Bellefonte, with a reported population of 5,888. That means the number of crimes per capita is 0.0, which translates into a 1 in 12000 chance of being the victim of a crime.
We only looked at Pennsylvania cities that have populations of more than 5,000. This filter left us with 341 of the biggest cities in Pennsylvania to rank.
We ranked each city for each criterion from 1 to 341 where 1 in any particular category is the safest.
Next, we averaged each place's two criteria to create a Safety Index. We crowned the place with the lowest overall Safety Score, "The Safest Place In Pennsylvania," with any ties going to the bigger city.
The safest city in Pennsylvania, based on our criteria, is Bellefonte. The most dangerous city in Pennsylvania? Philadelphia, where residents had a 1 in 18 chance of being the victim of a crime.
This article has been update for 2026. This report marks our eleventh time ranking the safest places to live in Pennsylvania. All the data comes from the FBI's Crime In The USA 2024 report.
Summary
Summary: The Safest Cities In The Keystone State
Looking at the data, you can tell that Bellefonte is as safe as they come in Pennsylvania, according to science and data.
But as most Pennsylvania residents would agree, almost every place here has its safe and not safe parts. So just make sure you're informed ahead of time.
The safest places in Pennsylvania are .
For more reading, check out:
The full plate
Where Are The Safest Cities In Pennsylvania For 2026?
Click any column to sort. All 341 ranked Pennsylvania cities.
| Rank | City | Population | Violent / 100k | Property / 100k | Murders / 100k | Murders |
|---|---|---|---|---|---|---|
| 1 | Bellefonte, PA | 5,888 | 0 | 0 | 0 | 0 |
| 2 | Luzerne, PA | 5,127 | 0 | 0 | 0 | 0 |
| 3 | East Marlborough, PA | 8,072 | 0 | 37 | 0 | 0 |
| 4 | West Vincent, PA | 6,907 | 0 | 86 | 0 | 0 |
| 5 | Pine Creek, PA | 5,839 | 0 | 102 | 0 | 0 |
| 6 | Upper Makefield, PA | 8,818 | 0 | 124 | 0 | 0 |
| 7 | South Lebanon, PA | 10,598 | 0 | 160 | 0 | 0 |
| 8 | Centerville, PA | 5,487 | 0 | 182 | 0 | 0 |
| 9 | Forest City, PA | 8,384 | 11 | 71 | 0 | 0 |
| 10 | Tulpehocken, PA | 5,642 | 17 | 17 | 0 | 0 |
| 11 | Neshannock, PA | 9,614 | 10 | 208 | 0 | 0 |
| 12 | Upper Uwchlan, PA | 13,625 | 0 | 271 | 0 | 0 |
| 13 | Fox Chapel, PA | 5,129 | 0 | 292 | 0 | 0 |
| 14 | Lower Heidelberg, PA | 6,784 | 14 | 221 | 0 | 0 |
| 15 | O'Hara, PA | 8,875 | 22 | 202 | 0 | 0 |
| 16 | Bedminster, PA | 7,469 | 0 | 374 | 0 | 0 |
| 17 | East Fallowfield, PA | 7,944 | 25 | 163 | 0 | 0 |
| 18 | Hampton, PA | 17,771 | 11 | 348 | 0 | 0 |
| 19 | Hampden, PA | 35,576 | 22 | 238 | 0 | 0 |
| 20 | East Vincent, PA | 7,815 | 12 | 332 | 0 | 0 |
| 21 | Murrysville, PA | 20,674 | 24 | 232 | 0 | 0 |
| 22 | Cecil, PA | 15,206 | 26 | 217 | 6 | 1 |
| 23 | Mill Hall, PA | 5,129 | 38 | 0 | 0 | 0 |
| 24 | Kennett, PA | 9,455 | 31 | 169 | 0 | 0 |
| 25 | Lower Salford, PA | 16,255 | 18 | 362 | 0 | 0 |
| 26 | Franconia, PA | 13,488 | 14 | 392 | 0 | 0 |
| 27 | Wright, PA | 5,747 | 17 | 382 | 0 | 0 |
| 28 | North Sewickley, PA | 5,414 | 36 | 110 | 0 | 0 |
| 29 | Lititz, PA | 9,820 | 10 | 437 | 0 | 0 |
| 30 | Cornwall, PA | 6,813 | 44 | 29 | 0 | 0 |
| 31 | West Manheim, PA | 10,755 | 0 | 483 | 0 | 0 |
| 32 | South Londonderry, PA | 8,798 | 22 | 352 | 0 | 0 |
| 33 | Castle Shannon, PA | 8,039 | 24 | 323 | 0 | 0 |
| 34 | Smith, PA | 5,582 | 0 | 483 | 0 | 0 |
| 35 | Buckingham, PA | 20,736 | 19 | 400 | 9 | 2 |
| 36 | Millersville, PA | 9,785 | 10 | 470 | 0 | 0 |
| 37 | West Earl, PA | 12,547 | 31 | 270 | 0 | 0 |
| 38 | Selinsgrove, PA | 5,513 | 36 | 253 | 0 | 0 |
| 39 | Findlay, PA | 6,592 | 15 | 455 | 0 | 0 |
| 40 | East Brandywine, PA | 10,410 | 48 | 105 | 0 | 0 |
| 41 | Northampton, PA | 10,414 | 28 | 364 | 0 | 0 |
| 42 | Dallas, PA | 9,265 | 43 | 226 | 0 | 0 |
| 43 | Mount Joy, PA | 8,349 | 23 | 407 | 0 | 0 |
| 44 | Briar Creek, PA | 5,123 | 19 | 468 | 0 | 0 |
| 45 | New Hanover, PA | 13,694 | 36 | 328 | 0 | 0 |
| 46 | East Cocalico, PA | 14,775 | 20 | 487 | 0 | 0 |
| 47 | Chartiers, PA | 9,338 | 21 | 481 | 0 | 0 |
| 48 | Solebury, PA | 8,628 | 11 | 533 | 0 | 0 |
| 49 | Buffalo, PA | 8,228 | 60 | 60 | 0 | 0 |
| 50 | Olyphant, PA | 5,382 | 37 | 371 | 0 | 0 |
| 51 | South Heidelberg, PA | 14,489 | 34 | 393 | 0 | 0 |
| 52 | Sunbury, PA | 9,485 | 52 | 242 | 0 | 0 |
| 53 | Kiskiminetas, PA | 5,700 | 17 | 526 | 0 | 0 |
| 54 | Plum, PA | 26,145 | 61 | 152 | 0 | 0 |
| 55 | Upper Saucon, PA | 17,864 | 22 | 503 | 5 | 1 |
| 56 | South Fayette, PA | 18,472 | 54 | 270 | 0 | 0 |
| 57 | South Park, PA | 13,630 | 36 | 418 | 0 | 0 |
| 58 | Plumstead, PA | 14,391 | 20 | 528 | 0 | 0 |
| 59 | Upper Macungie, PA | 29,196 | 20 | 530 | 0 | 0 |
| 60 | Canonsburg, PA | 9,590 | 62 | 208 | 0 | 0 |
| 61 | Forks, PA | 16,568 | 18 | 567 | 0 | 0 |
| 62 | Robeson, PA | 7,711 | 38 | 427 | 0 | 0 |
| 63 | Beaver, PA | 7,368 | 40 | 407 | 0 | 0 |
| 64 | East Earl, PA | 6,827 | 29 | 498 | 0 | 0 |
| 65 | Amity, PA | 13,428 | 52 | 379 | 0 | 0 |
| 66 | North Strabane, PA | 17,077 | 64 | 263 | 0 | 0 |
| 67 | Upper Southampton, PA | 15,057 | 59 | 318 | 0 | 0 |
| 68 | Franklin Park, PA | 14,871 | 73 | 215 | 0 | 0 |
| 69 | Lower Providence, PA | 25,975 | 26 | 546 | 0 | 0 |
| 70 | Nether Providence, PA | 14,449 | 27 | 539 | 0 | 0 |
| 71 | Whitpain, PA | 20,451 | 14 | 660 | 0 | 0 |
| 72 | New Britain, PA | 12,260 | 32 | 505 | 0 | 0 |
| 73 | East Pikeland, PA | 8,755 | 57 | 376 | 0 | 0 |
| 74 | North Londonderry, PA | 8,965 | 44 | 446 | 0 | 0 |
| 75 | Cranberry, PA | 34,970 | 11 | 700 | 0 | 0 |
| 76 | Brighton, PA | 8,754 | 91 | 57 | 0 | 0 |
| 77 | Upper Gwynedd, PA | 17,273 | 28 | 567 | 0 | 0 |
| 78 | Doylestown, PA | 18,000 | 27 | 577 | 0 | 0 |
| 79 | New Cumberland, PA | 7,560 | 52 | 436 | 0 | 0 |
| 80 | Clarks Summit, PA | 6,569 | 45 | 471 | 0 | 0 |
| 81 | Upper Nazareth, PA | 8,497 | 82 | 235 | 0 | 0 |
| 82 | Palmerton, PA | 5,623 | 17 | 693 | 0 | 0 |
| 83 | Lower Makefield, PA | 33,400 | 29 | 571 | 2 | 1 |
| 84 | Parkesburg, PA | 5,210 | 95 | 57 | 0 | 0 |
| 85 | Lower Burrell, PA | 11,502 | 86 | 234 | 0 | 0 |
| 86 | West Brandywine, PA | 11,756 | 68 | 382 | 0 | 0 |
| 87 | Upper Pottsgrove, PA | 6,323 | 79 | 300 | 0 | 0 |
| 88 | Towamencin, PA | 17,925 | 33 | 591 | 5 | 1 |
| 89 | Willistown, PA | 11,380 | 87 | 246 | 0 | 0 |
| 90 | Upper Allen, PA | 24,279 | 78 | 337 | 0 | 0 |
| 91 | Hopewell, PA | 13,248 | 60 | 460 | 0 | 0 |
| 92 | West Lampeter, PA | 17,320 | 51 | 508 | 0 | 0 |
| 93 | Warrington, PA | 26,355 | 22 | 743 | 0 | 0 |
| 94 | New Holland, PA | 12,898 | 23 | 759 | 0 | 0 |
| 95 | Shaler, PA | 26,801 | 48 | 555 | 3 | 1 |
| 96 | Ferguson, PA | 18,949 | 68 | 448 | 0 | 0 |
| 97 | Hellam, PA | 10,944 | 100 | 283 | 0 | 0 |
| 98 | Easttown, PA | 11,076 | 81 | 424 | 0 | 0 |
| 99 | East Pennsboro, PA | 21,266 | 47 | 616 | 0 | 0 |
| 100 | Valley, PA | 7,965 | 100 | 313 | 0 | 0 |
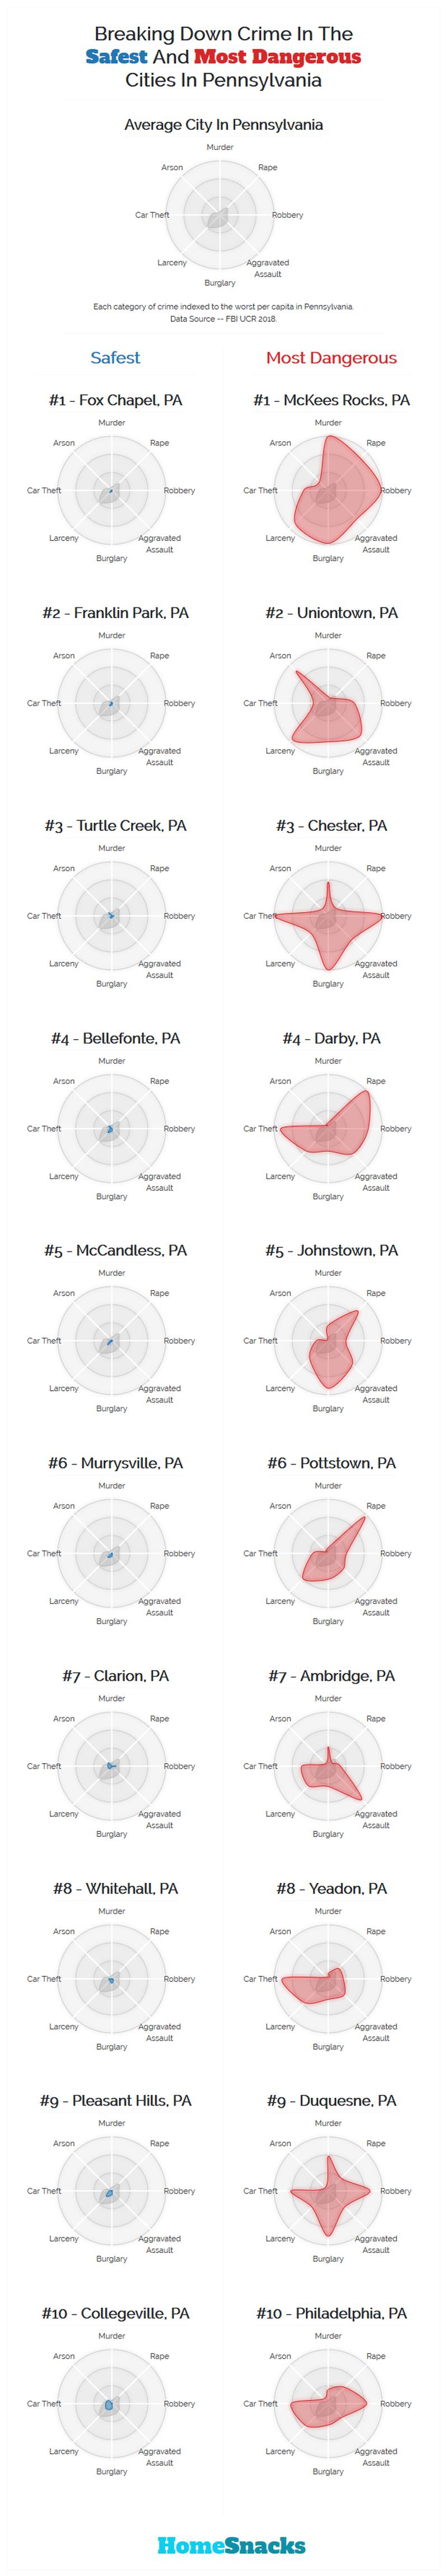
Breaking Down Crime In The Safest And Most Dangerous Cities In Pennsylvania
Keep exploring