The 10 Safest Cities In New Jersey For 2023
The safest cities in New Jersey are New Hanover and Matawan for 2023.

When you first think of New Jersey, Newark may come to mind. This city is best known as an airport hub rather than the safest city in the state.
But it turns out that when you get past Newark, some of the safest places to live on the East Coast are these safe places in New Jersey. In particular, we looked at the most recent FBI crime data to see which areas in the Garden State are the safest. Furthermore, our analysis ranks New Jersey as the 4th safest state in America. But what about within New Jersey? Which areas offer the most to residents in terms of safety?
These New Jersey locations offer a compelling blend of safety and lifestyle, sure to appeal to many future residents. So grab some Taylor Ham, a nice bagel, and fresh corn as we look at the safest places in New Jersey.
Here are the 10 safest cities to live in New Jersey for 2023:
- New Hanover
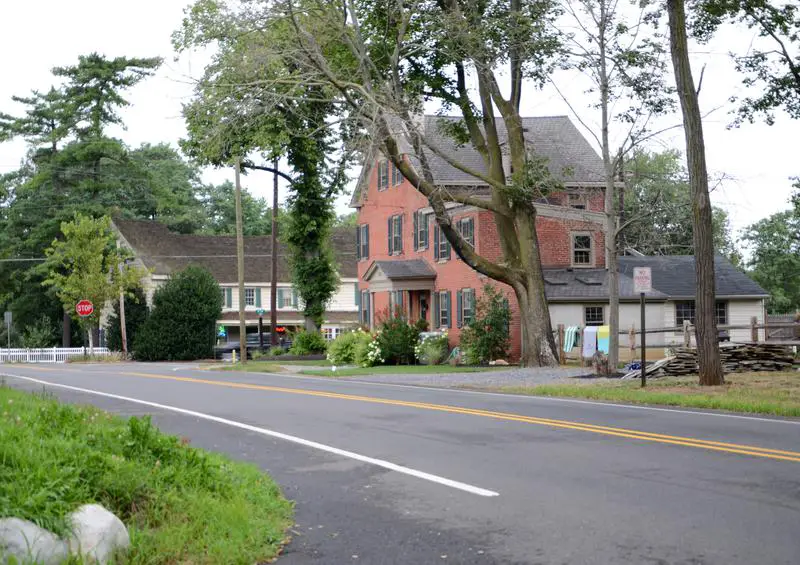
- Matawan (Photos)
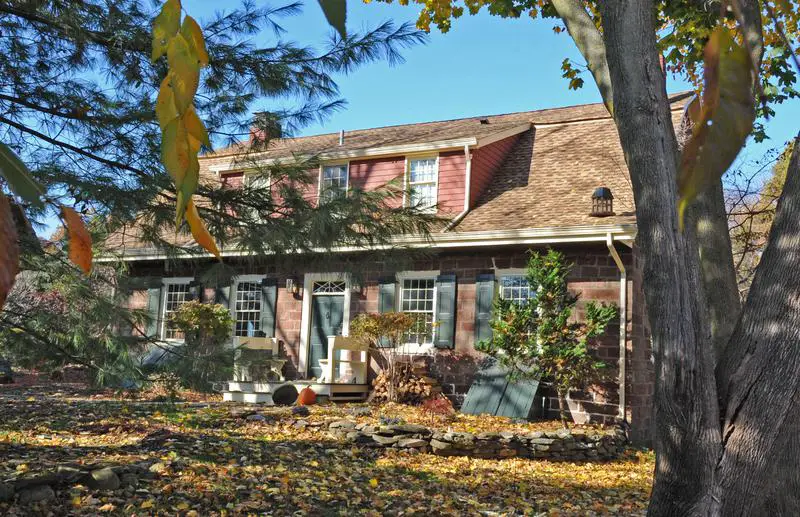
- Park Ridge (Photos)
- Oradell (Photos)
- Chesterfield
- Hasbrouck Heights (Photos)
- River Vale
- Berkeley Heights
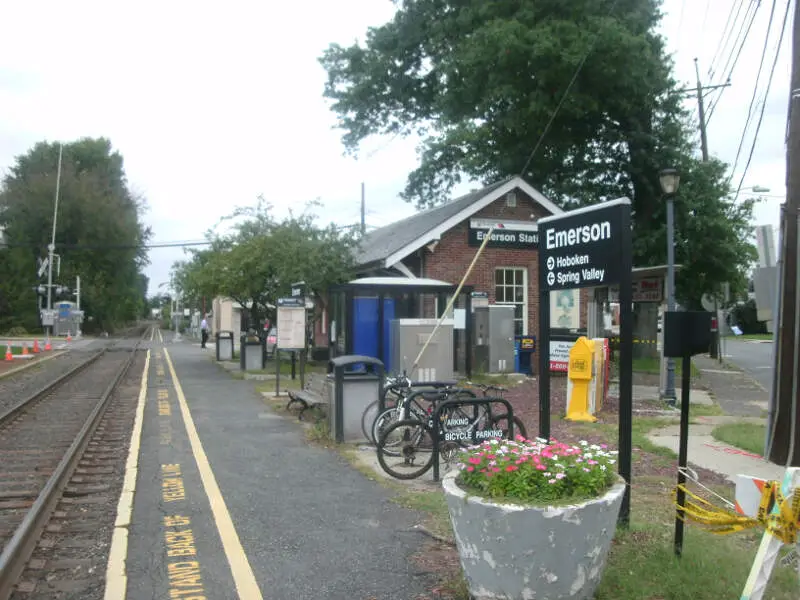
- Emerson (Photos)
- Bernards
What are the safest places to live in new jersey for 2023? Using the latest FBI crime data, the safest city in New Jersey is New Hanover for 2023.
If you're looking for a safe place to call home in the Garden State, look no further than New Hanover.
Read on to see if your city ranked in our top ten and to learn more about how we got our ranking of New Jersey's safest places.
For more reading on safe places to live in and around New Jersey, check out:
- Safest States In America
- Safest Cities In America
- Best Places To Live In New Jersey
- Cheapest Places To Live In New Jersey
Table Of Contents
The 10 Safest Cities In New Jersey For 2023
Population: 7,859
Violent Crimes Per 100k: 0 (11th safest)
Property Crimes Per 100k: 38 (safest)
More on New Hanover:
New Hanover takes the cake as the safest place to live in New Jersey for 2023 according to the most recent FBI data.
It's the start of what we are calling, the NJ11, the ten places in the state that had no violent crime reports in the last year. That total reduction in violent crime coupled with the safest rate of property crime was enough to get New Hanover to the top of the top.
New Hanover is located in Burlington County with median household incomes floating around $70,000 -- you don't need to commit crime when you have that much cash on hand.
/10
Population: 8,613
Violent Crimes Per 100k: 0 (11th safest)
Property Crimes Per 100k: 69 (third safest)
More on Matawan: Homes For Sale | Data | Detailed Crime Report
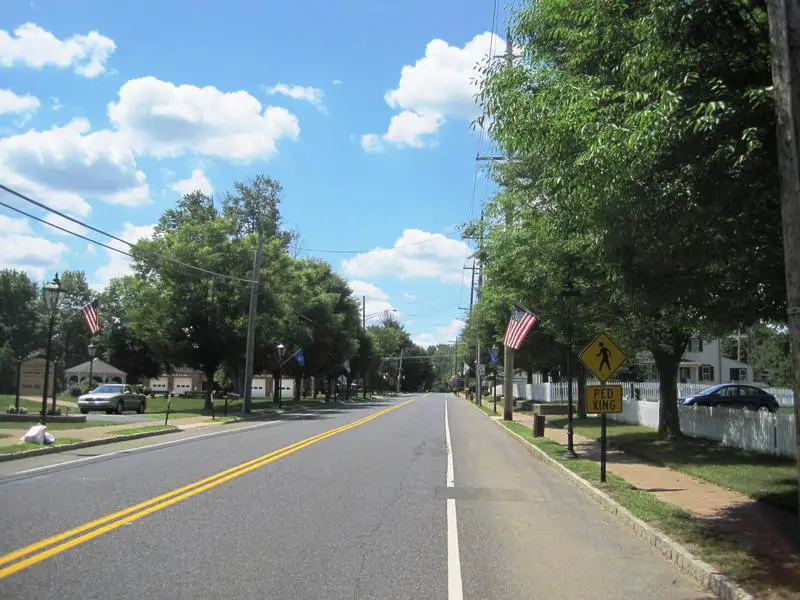
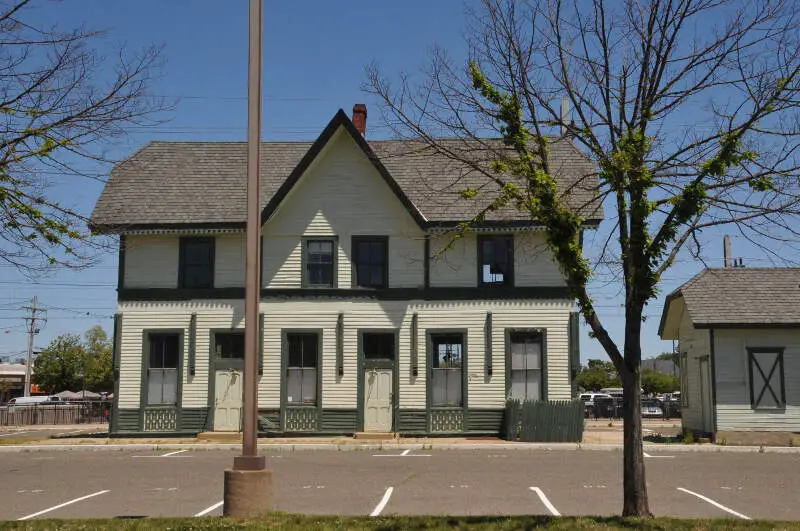
Our next stop around NJ's safest places brings us to Matawan -- and we still haven't had to pump our own gas as we've made the trip.
Matawan is a great place to live in Monmouth county because it's super safe and actually somewhat affordable by New Jersey standards.
Home to the annual KiDz HuB Awards Gala and plenty of escape rooms, there's so much to do that you'd never have time to even think of committing a crime. Or you probably went to sleep before 10pm and just weren't up late enough to even bother trying to steal something from a neighbor.
/10
Population: 8,688
Violent Crimes Per 100k: 0 (11th safest)
Property Crimes Per 100k: 149 (fifth safest)
More on Park Ridge: Homes For Sale | Data | Detailed Crime Report
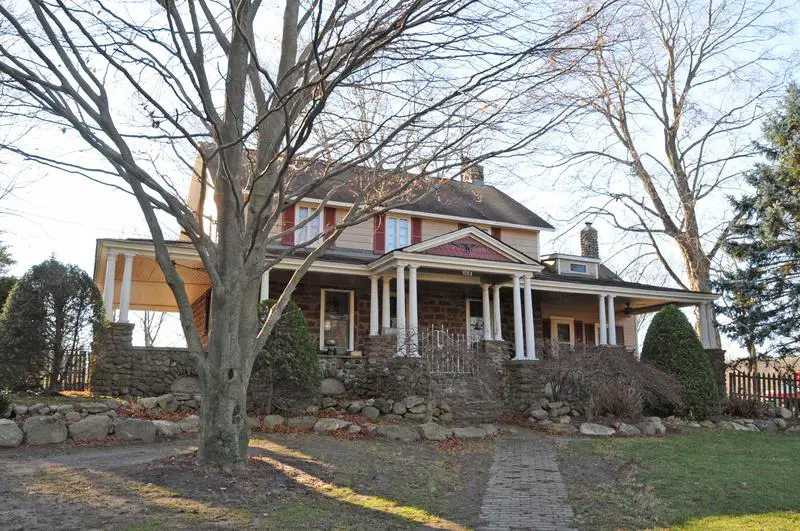
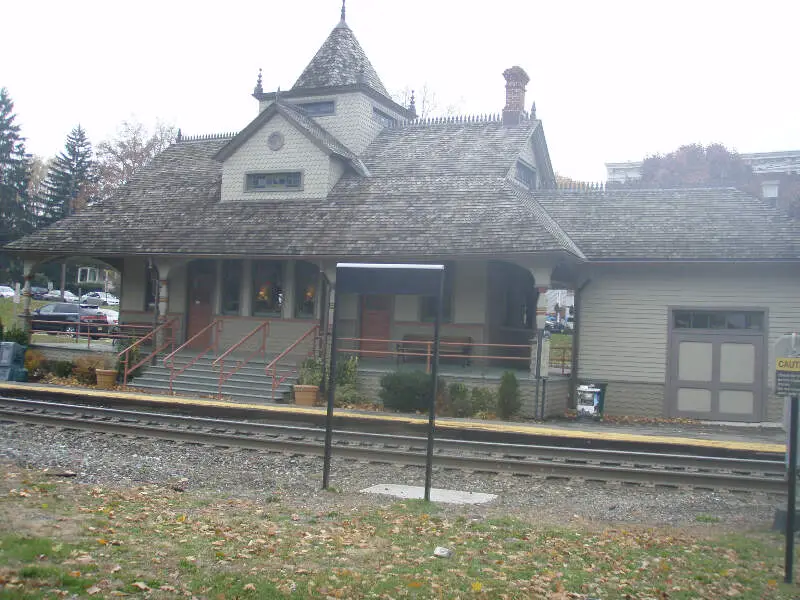
Next on our list of the top ten safest places to live in New Jersey is Park Ridge -- another Bergen county keeper that also ranks as one of the best places to live in the Garden State.
A miniscule property crime and violent crime rate, the city jumped way up the rankings this year to just crack into the top ten.
The city is very wealthy and incredibly well educated. And we all know that smart rich people have better things to do than steal candy from each other's babies.
/10
Population: 8,447
Violent Crimes Per 100k: 0 (11th safest)
Property Crimes Per 100k: 177 (seventh safest)
More on Oradell: Homes For Sale | Data | Detailed Crime Report
Population: 7,557
Violent Crimes Per 100k: 0 (11th safest)
Property Crimes Per 100k: 185 (eighth safest)
More on Chesterfield:
Chesterfield NJ, home to the first African American winner of the Top Fuel National Hot Rod Association championship and the blacksmith who in 1797 received the first patent for a cast iron plow, can now add being the third safest place in New Jersey for 2023 according to HomeSnacks to its list of accomplishments.
We know, it's a big deal.
The town of some 7,500 people is part of the NJ11 while also ranking as having the thirteenth best property crime rate in the state. That means you have a much higher chance of running into your ex-girlfriend in the library than ever getting your purse stolen. TripAdvisor suggests stopping by Russo's Orchard Lane Farm if you're ever in town.

/10
Population: 11,988
Violent Crimes Per 100k: 0 (11th safest)
Property Crimes Per 100k: 241 (16th safest)
More on Hasbrouck Heights: Homes For Sale | Data | Detailed Crime Report
Population: 10,007
Violent Crimes Per 100k: 0 (11th safest)
Property Crimes Per 100k: 249 (17th safest)
More on River Vale:
River Vale, a town in Bergen County, has the 17th safest lowest property crime rate in the state and an incredibly low violent crime rate. If not for these towns with virtually no reported violent crime, River Vale would have maintained it's top overall ranking from yester year.
River Vale has a solid school district, a standard New Jersey cost of living, and low crime. It's no wonder it continues to show up on our lists year after. And you knows it safe at the local country club or two.

Population: 13,371
Violent Crimes Per 100k: 0 (11th safest)
Property Crimes Per 100k: 254 (18th safest)
More on Berkeley Heights:
/10
Population: 7,900
Violent Crimes Per 100k: 0 (11th safest)
Property Crimes Per 100k: 278 (21st safest)
More on Emerson: Homes For Sale | Data | Detailed Crime Report
Population: 27,130
Violent Crimes Per 100k: 0 (11th safest)
Property Crimes Per 100k: 302 (23rd safest)
More on Bernards:
Want to get from Bernards Township, New Jersey, to the middle of the action in New York City? Just jump on I-78 and drive for about hour. This makes the town a perfect bedroom community for commuters to Manhattan. It doesn't hurt that the area also represents the number 10 safest place to live in the state.
Bernards offers an idyllic suburban existence. The median income equals $103993 and the unemployment rate comes in at 6.23. But safety represents the real headline attraction. In a community of 27,130 inhabitants, Bernards Township had just 82 property crimes in a year, including 9 burglaries and 16 cars stolen.
At the same time, violence is nearly nonexistent in the town. There were 0 violent crimes in a year.
Methodology: How we calculated the safest cities in New Jersey for 2023
While there are surveys and public polls on what cities in New Jersey are the safest, we wanted to rely on something other than speculation and opinion. Instead, we looked at the hard numbers from the FBI's most recent crime report in New Jersey.
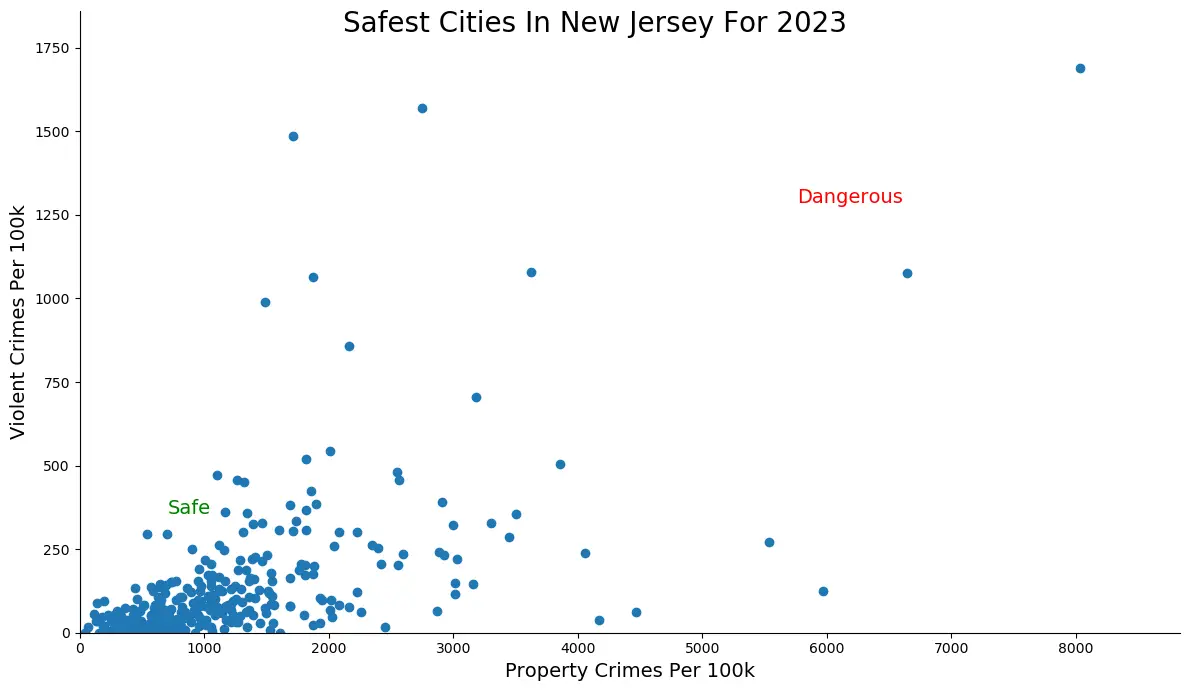
Specifically, we analyzed the FBI's Uniform Crime Report, which summarizes the number of property and violent crimes in each city annually. We used two criteria:
- Violent crimes per capita (murders, assaults, rapes, armed robberies)
- Property crimes per capita (thefts, burglaries, motor vehicle thefts)
For example, there were 3 crimes committed in New Hanover, with a reported population of 7,859. That means the number of crimes per capita is 0.0004, which translates into a 1 in 2,619 chance of being the victim of a crime.
We only looked at New Jersey cities that have populations of more than 5,000. This filter left us with 331 of the biggest cities in New Jersey to rank.
We ranked each city for each criterion from 1 to 331 where 1 in any particular category is the safest.
Next, we averaged each place's two criteria to create a Safety Index. We crowned the place with the lowest overall Safety Score "The Safest Place In New Jersey," with any ties going to the bigger city.
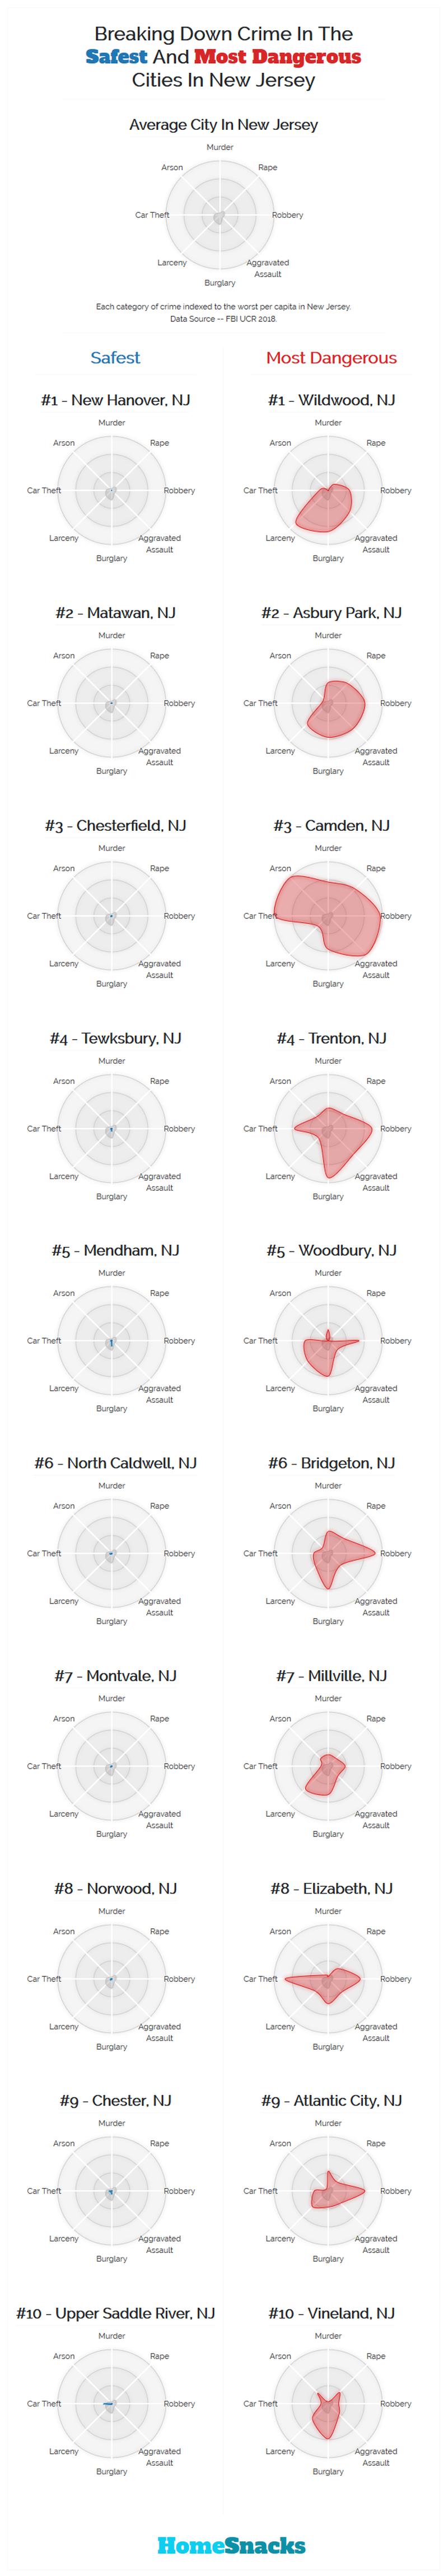
The safest city in New Jersey, based on our criteria, is New Hanover. The most dangerous city in New Jersey? Asbury Park, where residents had a 1 in 21 chance of being the victim of a crime.
This article has been update for 2023. This report marks our sixth time ranking the safest places to live in New Jersey. All the data comes from the FBI's Crime In The USA 2021 report.
Summary: The Safest Cities In The Garden State
Looking at the data, you can tell that New Hanover is as safe as they come in New Jersey, according to science and data.
But as most New Jersey residents would agree, almost every place here has its safe and not safe parts. So just make sure you're informed ahead of time.
Here's a look at the most dangerous cities in New Jersey according to the data:
- Asbury Park
- Millville
- Bridgeton
- Best Places To Raise A Family In New Jersey
- Best Places To Buy A House In New Jersey
- Best Places To Retire In New Jersey
Where Are The 10 Safest Cities In New Jersey For 2023?
| Rank | City | Population | Violent Crimes Per 100k | Property Crimes Per 100k |
|---|---|---|---|---|
| 1 | New Hanover, NJ | 7,859 | 0 | 38 |
| 2 | Matawan, NJ | 8,613 | 0 | 69 |
| 3 | Park Ridge, NJ | 8,688 | 0 | 149 |
| 4 | Oradell, NJ | 8,447 | 0 | 177 |
| 5 | Chesterfield, NJ | 7,557 | 0 | 185 |
| 6 | Hasbrouck Heights, NJ | 11,988 | 0 | 241 |
| 7 | River Vale, NJ | 10,007 | 0 | 249 |
| 8 | Berkeley Heights, NJ | 13,371 | 0 | 254 |
| 9 | Emerson, NJ | 7,900 | 0 | 278 |
| 10 | Bernards, NJ | 27,130 | 0 | 302 |
| 11 | Ringwood, NJ | 12,177 | 16 | 205 |
| 12 | Woolwich, NJ | 13,278 | 7 | 353 |
| 13 | Hillsdale, NJ | 10,308 | 0 | 378 |
| 14 | Old Tappan, NJ | 5,904 | 16 | 220 |
| 15 | Bedminster, NJ | 7,963 | 0 | 401 |
| 16 | Denville, NJ | 16,400 | 12 | 341 |
| 17 | Warren, NJ | 15,689 | 6 | 363 |
| 18 | Robbinsville, NJ | 14,628 | 13 | 307 |
| 19 | Randolph, NJ | 25,311 | 3 | 371 |
| 20 | Holland, NJ | 5,074 | 19 | 197 |
| 21 | Vernon, NJ | 21,819 | 4 | 407 |
| 22 | Wanaque, NJ | 12,281 | 24 | 40 |
| 23 | Glen Rock, NJ | 11,705 | 8 | 410 |
| 24 | Roseland, NJ | 5,829 | 0 | 480 |
| 25 | Cresskill, NJ | 8,672 | 11 | 380 |
| 26 | Mahwah, NJ | 26,201 | 19 | 351 |
| 27 | Montvale, NJ | 8,643 | 23 | 300 |
| 28 | Linwood, NJ | 6,612 | 15 | 378 |
| 29 | Upper Saddle River, NJ | 8,199 | 12 | 414 |
| 30 | Madison, NJ | 18,563 | 10 | 447 |
| 31 | Sparta, NJ | 18,503 | 16 | 378 |
| 32 | Long Hill, NJ | 8,389 | 0 | 512 |
| 33 | Wyckoff, NJ | 17,589 | 17 | 369 |
| 34 | Clinton, NJ | 12,465 | 24 | 328 |
| 35 | Plumsted, NJ | 8,598 | 11 | 465 |
| 36 | Chester, NJ | 7,640 | 13 | 445 |
| 37 | Woodcliff Lake, NJ | 6,094 | 16 | 410 |
| 38 | Jefferson, NJ | 21,409 | 32 | 196 |
| 39 | Dumont, NJ | 18,340 | 27 | 305 |
| 40 | Butler, NJ | 7,643 | 13 | 484 |
| 41 | Readington, NJ | 15,813 | 12 | 486 |
| 42 | Mountainside, NJ | 6,902 | 0 | 565 |
| 43 | Mendham, NJ | 5,632 | 17 | 426 |
| 44 | Independence, NJ | 5,386 | 37 | 167 |
| 45 | Bogota, NJ | 8,342 | 0 | 587 |
| 46 | New Providence, NJ | 13,741 | 21 | 400 |
| 47 | Rockaway, NJ | 6,250 | 16 | 496 |
| 48 | Bernardsville, NJ | 7,883 | 0 | 608 |
| 49 | Westwood, NJ | 11,495 | 26 | 374 |
| 50 | North Caldwell, NJ | 6,666 | 30 | 360 |
| 51 | Hopewell, NJ | 17,641 | 22 | 430 |
| 52 | Lebanon, NJ | 6,055 | 16 | 511 |
| 53 | Florham Park, NJ | 11,455 | 8 | 584 |
| 54 | Hillsborough, NJ | 42,116 | 35 | 339 |
| 55 | Fair Haven, NJ | 5,696 | 17 | 509 |
| 56 | Hardyston, NJ | 7,744 | 25 | 426 |
| 57 | Little Silver, NJ | 5,761 | 17 | 538 |
| 58 | Midland Park, NJ | 7,214 | 41 | 332 |
| 59 | Jamesburg, NJ | 5,878 | 51 | 221 |
| 60 | Wood-Ridge, NJ | 9,489 | 21 | 505 |
| 61 | Pequannock, NJ | 14,887 | 26 | 450 |
| 62 | Bergenfield, NJ | 27,347 | 47 | 307 |
| 63 | Montgomery, NJ | 23,268 | 38 | 361 |
| 64 | North Hanover, NJ | 7,443 | 53 | 228 |
| 65 | Kinnelon, NJ | 9,859 | 10 | 639 |
| 66 | Andover, NJ | 5,826 | 51 | 274 |
| 67 | Mount Olive, NJ | 28,973 | 41 | 358 |
| 68 | West Milford, NJ | 26,310 | 41 | 353 |
| 69 | Rumson, NJ | 6,675 | 0 | 734 |
| 70 | Plainsboro, NJ | 22,847 | 35 | 393 |
| 71 | Byram, NJ | 7,880 | 38 | 368 |
| 72 | Wharton, NJ | 6,728 | 44 | 356 |
| 73 | Waldwick, NJ | 10,156 | 19 | 551 |
| 74 | Fanwood, NJ | 7,732 | 25 | 504 |
| 75 | Bridgewater, NJ | 44,006 | 13 | 636 |
| 76 | Roxbury, NJ | 23,676 | 16 | 599 |
| 77 | Caldwell, NJ | 7,938 | 0 | 768 |
| 78 | Jackson, NJ | 58,120 | 46 | 363 |
| 79 | Manalapan, NJ | 39,353 | 30 | 487 |
| 80 | Middlesex Borough, NJ | 13,669 | 21 | 548 |
| 81 | Tenafly, NJ | 14,427 | 34 | 450 |
| 82 | Norwood, NJ | 5,792 | 51 | 345 |
| 83 | Cliffside Park, NJ | 26,400 | 56 | 329 |
| 84 | Middletown, NJ | 65,170 | 24 | 547 |
| 85 | River Edge, NJ | 11,431 | 8 | 734 |
| 86 | Chatham, NJ | 8,586 | 11 | 710 |
| 87 | Palisades Park, NJ | 20,818 | 33 | 504 |
| 88 | Green Brook, NJ | 7,004 | 14 | 699 |
| 89 | Allendale, NJ | 6,751 | 14 | 696 |
| 90 | Cranford, NJ | 25,189 | 23 | 591 |
| 91 | Northfield, NJ | 7,979 | 0 | 914 |
| 92 | Manchester, NJ | 43,856 | 31 | 533 |
| 93 | Ridgewood, NJ | 25,036 | 31 | 531 |
| 94 | Branchburg, NJ | 14,526 | 34 | 523 |
| 95 | Verona, NJ | 14,233 | 21 | 632 |
| 96 | West Caldwell, NJ | 10,841 | 27 | 571 |
| 97 | South River, NJ | 16,240 | 73 | 277 |
| 98 | Scotch Plains, NJ | 24,313 | 20 | 674 |
| 99 | Morris, NJ | 22,100 | 36 | 529 |
| 100 | Cedar Grove, NJ | 12,483 | 24 | 632 |
Breaking Down Crime In The Safest And Most Dangerous Cities In New Jersey
About Chris Kolmar
Chris Kolmar has been in the real estate business for almost ten years now. He originally worked for Movoto Real Estate as the director of marketing before founding HomeSnacks.
He believes the key to finding the right place to live comes down to looking at the data, reading about things to do, and, most importantly, checking it out yourself before you move.
If you've been looking for a place to live in the past several years, you've probably stumbled upon his writing already.
You can find out more about him on LinkedIn.
Connect With 
100 Calorie Emails.
Once Per Week.
Guilt Free.