

Do you live in one of the most miserable places in America? We’re not talking about the weather or the sports teams. We’re talking about the everyday stuff that grinds people down: long commutes, no health insurance, no job, and never being able to afford a place of your own.
So we used Saturday Night Science to rank the 100 biggest cities in America on seven measures of everyday stress, then asked which ones come out worst.
The most miserable city in America for 2026 is Newark, NJ — again. It held the top spot the last time we ran these numbers, too. Big, expensive coastal cities fill out most of the rest of the list.
The happiest big city? Boise, ID. Arizona suburbs like Scottsdale, Chandler, and Gilbert, plus Lincoln, Omaha, and Virginia Beach, fill out the happy end of the list.
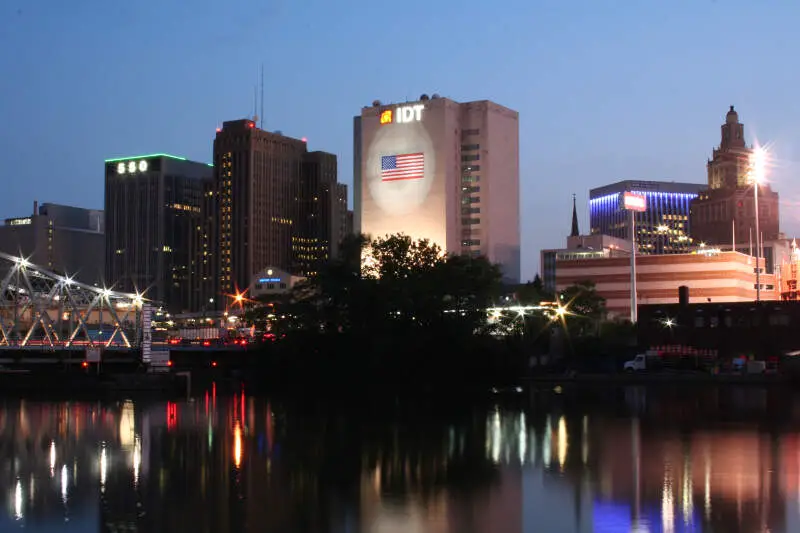
Newark holds onto the title it had the last time we ran these numbers. It’s the only big city where fewer than one in four homes is owner-occupied (24.4%), 11.6% of workers are unemployed — the highest rate in the top ten — and almost one in five residents has no health insurance. Add a 33-minute commute and a 23% poverty rate, and it’s a tough place to catch a break.
Data | Crime | Cost of living | Compare
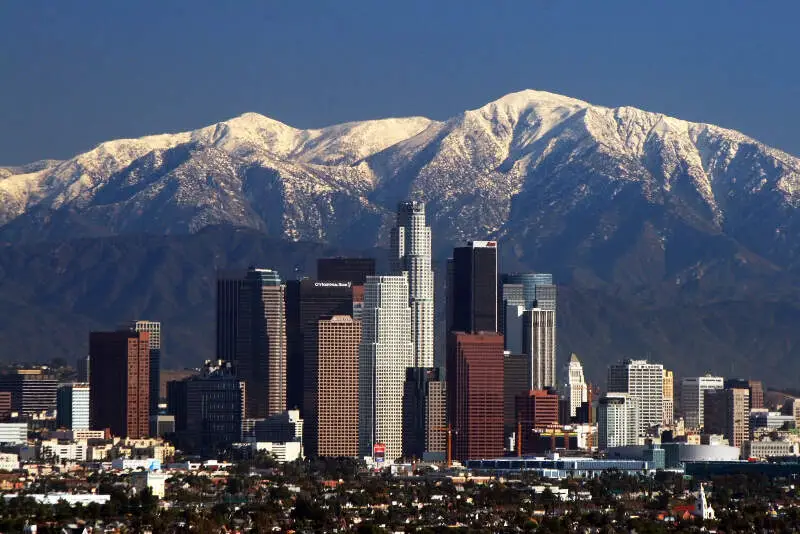
Los Angeles has one of the highest costs of living of any big city in America, which is a problem when only 36% of households own their home. Unemployment is 8.2%, and the average commute is almost 31 minutes — and anyone who has driven the 405 knows that number feels generous.
Data | Crime | Cost of living | Compare

New York has the longest commute of any big city in America, averaging more than 40 minutes each way. It’s also the most expensive city in the top ten, and only a third of homes are owner-occupied. At least 94% of residents have health insurance.
Data | Crime | Cost of living | Compare
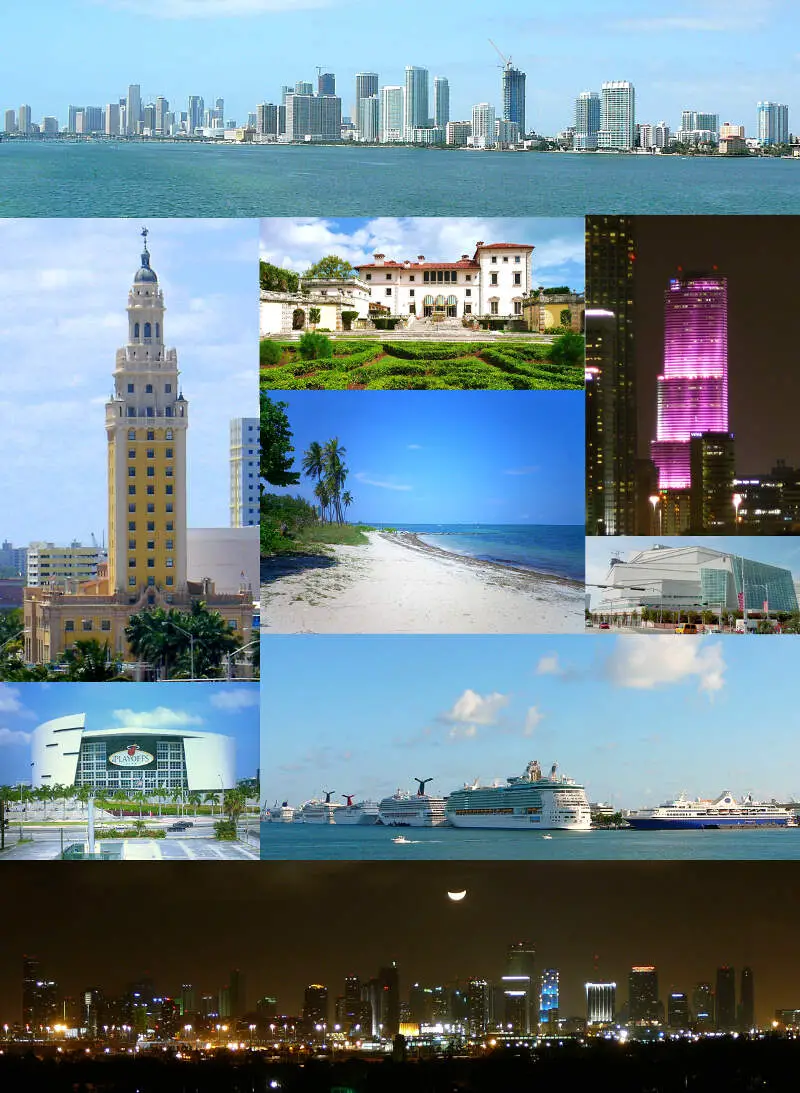
Miami has the second-lowest marriage rate in the top five (36.6%), fewer than a third of homes are owner-occupied, and 16% of residents have no health insurance. It’s a beautiful place, but the day-to-day math is hard.
Data | Crime | Cost of living | Compare
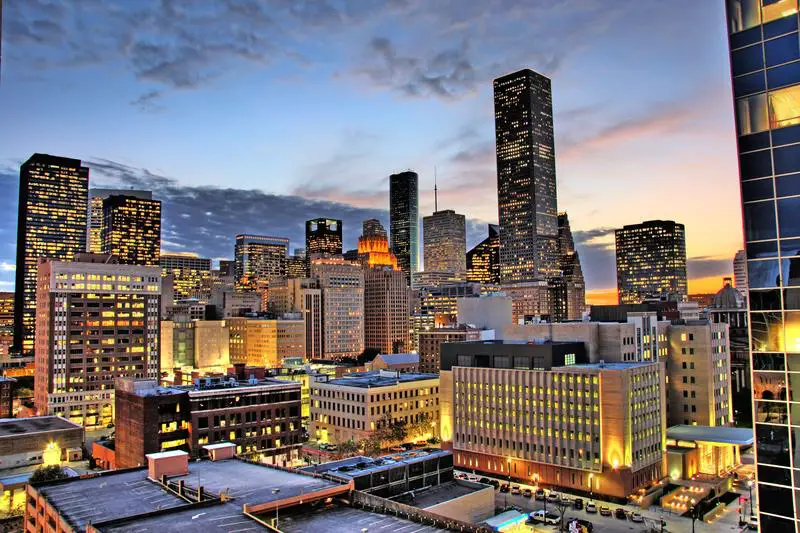
Houston has the highest uninsured rate in the top ten: 23.6% of residents don’t have health insurance. That’s more than one in five people, and it’s why the Bayou City lands in the top five despite a cost of living that’s cheaper than most of the cities on this list.
Data | Crime | Cost of living | Compare
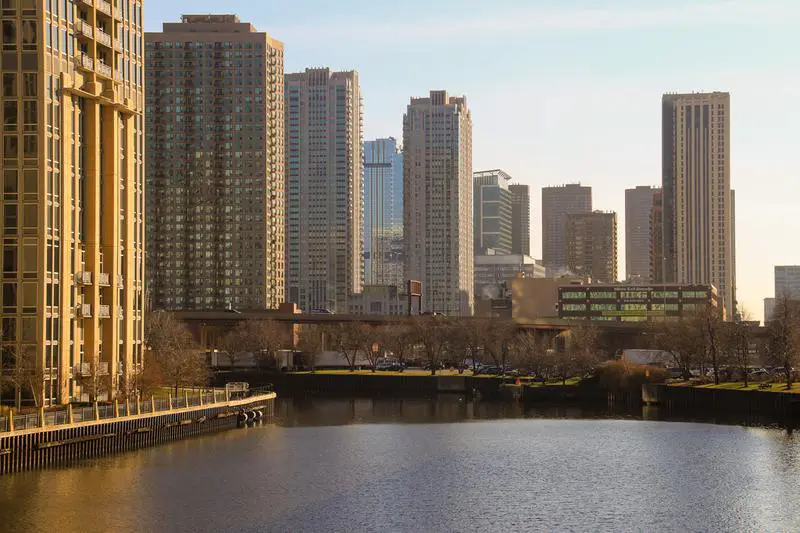
Chicago’s commute averages 33 minutes each way, 8% of workers are unemployed, and just 35.5% of adults are married. The cost of living is actually reasonable for a big city, but everything else adds up.
Data | Crime | Cost of living | Compare

Long Beach is basically Los Angeles-lite on this list: expensive, lots of renters, and long commutes. Only 41% of homes are owner-occupied, and the average drive to work is 30 minutes.
Data | Crime | Cost of living | Compare
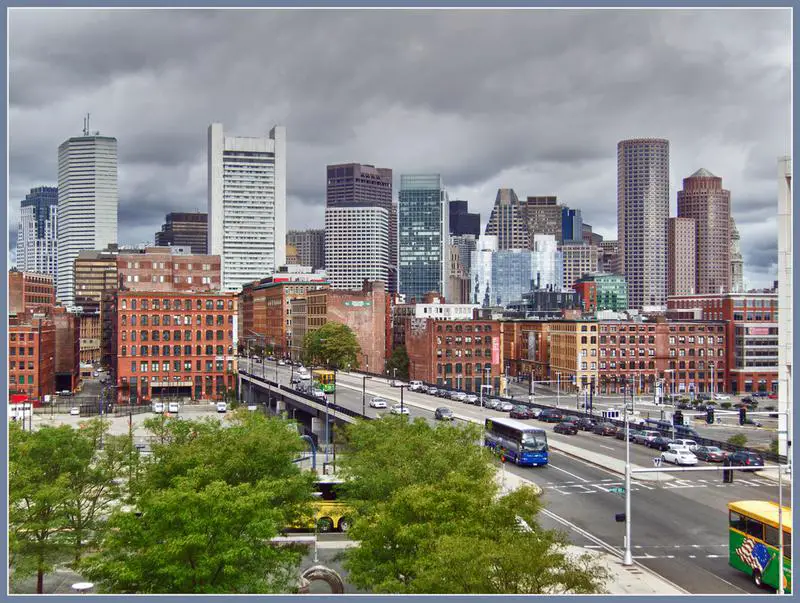
Boston has one of the lowest uninsured rates of any big city at just 2.9% — thank Massachusetts’ health care law for that. But only 36% of Boston homes are owner-occupied, the cost of living that’s 71% above the national average, and just 31% of adults are married.
Data | Crime | Cost of living | Compare
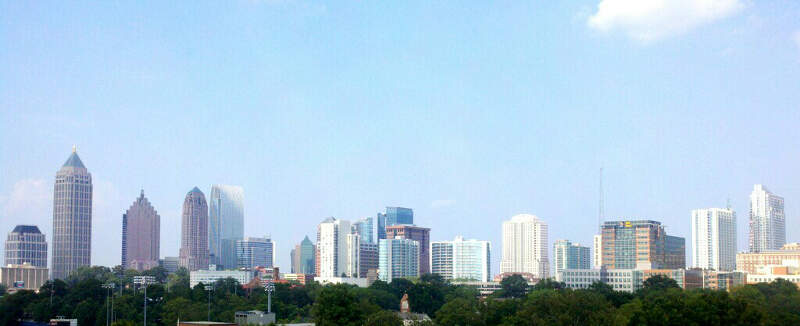
Atlanta has the lowest marriage rate in the top ten: only 29.5% of adults are married. One in six residents lives in poverty, and about 10% have no health insurance.
Data | Crime | Cost of living | Compare
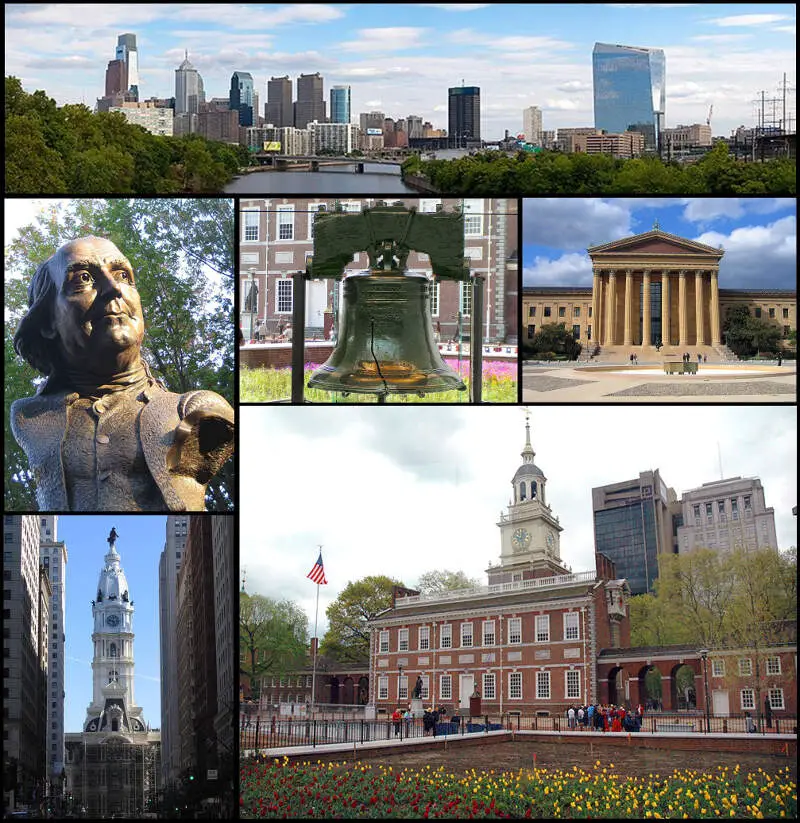
Philadelphia rounds out the ten most miserable big cities. It has the second-highest poverty rate in the top ten at 21.4%, and 8.1% of workers are unemployed. The upside? More than half of homes in Philly are owner-occupied, the highest rate in the top ten.
Data | Crime | Cost of living | Compare
The receipts
Compare the top ten
Pick a metric. The bars rescale. The red line is the United States’s statewide median.
the United States statewide median: $80,734
the United States statewide median: 12.5%
the United States statewide median: 5.2%
On the map
Where the most miserable cities in America are
Saturday Night Science
Methodology: How We Determined The Most Miserable Cities In America
In order to rank the unhappiest places in the USA, we had to decide what makes people happy. It isn’t a stretch to assume happy people have a steady job, health insurance, a short drive to work, a stable home life, and a home they own.
So we went to the Census Bureau’s 2020-2024 American Community Survey and the HomeSnacks cost of living index, and plugged these seven criteria into Saturday Night Science:
- Percentage of residents without health insurance
- Average commute time
- Unemployment rate
- Cost of living
- Percentage of adults who are married
- Homeownership rate
- Poverty rate
We ranked each of the 100 biggest cities in America (by population; census-designated places not included) from 1 to 100 for each criterion, then averaged the seven rankings into a Miserable Index. The city with the worst average earned the title “Most Miserable City In America.” Four cities — Nashville, Louisville, Lexington, and Boise — aren’t in our cost of living data, so they were scored on the other six.
We updated this report for 2026. This report is an opinion based on facts and is meant as infotainment — don’t freak out.
The full list
The Most Miserable To Happiest Big Cities In America
Click any column to sort. Search by city name.
| Rank | City | Population | Uninsured | Commute (Min) | Unemployment | Married | Homeowners | Poverty |
|---|---|---|---|---|---|---|---|---|
| 1 | Newark, NJ | 310,178 | 19.6% | 32.6 | 11.6% | 29.9% | 24.4% | 23.4% |
| 2 | Los Angeles, CA | 3,857,263 | 9.4% | 30.7 | 8.2% | 38.5% | 36.0% | 16.5% |
| 3 | New York, NY | 8,483,844 | 6.2% | 40.3 | 8.0% | 39.4% | 32.8% | 17.9% |
| 4 | Miami, FL | 459,745 | 16.3% | 27.3 | 5.2% | 36.6% | 30.8% | 19.4% |
| 5 | Houston, TX | 2,328,253 | 23.6% | 27.2 | 6.9% | 39.9% | 42.1% | 19.9% |
| 6 | Chicago, IL | 2,711,226 | 9.7% | 33.1 | 8.0% | 35.5% | 46.0% | 16.8% |
| 7 | Long Beach, CA | 455,548 | 8.3% | 29.9 | 6.5% | 37.6% | 41.2% | 14.8% |
| 8 | Boston, MA | 666,442 | 2.9% | 30.3 | 6.1% | 30.9% | 35.7% | 16.6% |
| 9 | Atlanta, GA | 505,268 | 10.1% | 26.5 | 5.9% | 29.5% | 46.4% | 16.9% |
| 10 | Philadelphia, PA | 1,579,706 | 7.1% | 31.7 | 8.1% | 31.9% | 51.8% | 21.4% |
| 11 | Baltimore, MD | 573,243 | 5.9% | 29.1 | 6.5% | 27.9% | 47.5% | 19.7% |
| 12 | Jersey City, NJ | 294,078 | 8.5% | 36.8 | 5.5% | 42.6% | 27.9% | 15.6% |
| 13 | Oakland, CA | 439,418 | 5.6% | 29.8 | 6.4% | 39.3% | 42.3% | 13.4% |
| 14 | Memphis, TN | 618,980 | 14.7% | 21.1 | 8.3% | 30.5% | 44.9% | 23.1% |
| 15 | Orlando, FL | 319,758 | 13.8% | 26.2 | 5.2% | 39.2% | 39.5% | 14.7% |
| 16 | Cleveland, OH | 366,097 | 8.0% | 22.5 | 10.8% | 23.5% | 41.7% | 30.6% |
| 17 | Detroit, MI | 638,530 | 7.4% | 24.8 | 14.0% | 22.3% | 50.3% | 32.7% |
| 18 | Dallas, TX | 1,307,930 | 22.7% | 25.7 | 4.9% | 39.7% | 42.4% | 16.7% |
| 19 | Stockton, CA | 322,326 | 6.8% | 31.7 | 8.6% | 40.5% | 53.9% | 15.5% |
| 20 | Milwaukee, WI | 566,973 | 9.0% | 22.4 | 6.2% | 28.7% | 41.8% | 22.8% |
| 21 | Cincinnati, OH | 311,224 | 7.8% | 22.4 | 6.8% | 29.9% | 39.8% | 25.5% |
| 22 | New Orleans, LA | 371,853 | 8.0% | 22.6 | 7.5% | 31.1% | 51.2% | 22.6% |
| 23 | Richmond, VA | 229,359 | 8.8% | 21.7 | 5.7% | 29.4% | 43.5% | 18.2% |
| 24 | San Francisco, CA | 830,235 | 3.2% | 30.4 | 6.1% | 40.6% | 38.2% | 11.2% |
| 25 | Fresno, CA | 545,970 | 6.1% | 22.4 | 8.9% | 40.5% | 50.1% | 20.1% |
| 26 | San Antonio, TX | 1,479,835 | 17.6% | 24.5 | 6.2% | 40.1% | 52.2% | 17.1% |
| 27 | Anaheim, CA | 344,521 | 9.9% | 27.4 | 5.8% | 44.5% | 46.2% | 12.4% |
| 28 | Hialeah, FL | 226,165 | 14.9% | 29.0 | 4.1% | 42.5% | 46.6% | 17.0% |
| 29 | Tucson, AZ | 547,073 | 10.6% | 21.9 | 6.2% | 35.8% | 51.8% | 18.9% |
| 30 | Las Vegas, NV | 660,400 | 13.3% | 25.7 | 7.4% | 42.7% | 56.6% | 14.0% |
| 31 | Norfolk, VA | 233,596 | 9.0% | 23.0 | 5.7% | 36.5% | 46.3% | 16.5% |
| 32 | Tampa, FL | 401,618 | 10.6% | 24.8 | 4.9% | 38.0% | 50.3% | 15.5% |
| 33 | Buffalo, NY | 276,854 | 4.1% | 19.9 | 7.3% | 28.9% | 43.0% | 26.0% |
| 34 | Riverside, CA | 319,069 | 8.9% | 31.3 | 6.3% | 42.7% | 56.8% | 12.2% |
| 35 | Sacramento, CA | 528,706 | 5.3% | 25.3 | 6.6% | 40.8% | 51.7% | 13.9% |
| 36 | Pittsburgh, PA | 304,759 | 4.8% | 22.7 | 6.1% | 31.1% | 47.7% | 20.1% |
| 37 | Columbus, OH | 914,802 | 10.3% | 21.5 | 5.1% | 36.0% | 44.1% | 18.1% |
| 38 | St. Louis, MO | 288,512 | 9.3% | 22.1 | 5.0% | 30.2% | 45.3% | 20.6% |
| 39 | Minneapolis, MN | 427,246 | 5.6% | 22.0 | 5.9% | 33.6% | 47.7% | 16.0% |
| 40 | North Las Vegas, NV | 278,595 | 13.3% | 26.7 | 8.5% | 43.9% | 63.6% | 12.1% |
| 41 | Denver, CO | 718,877 | 9.0% | 24.9 | 4.9% | 39.5% | 48.8% | 11.2% |
| 42 | Glendale, AZ | 252,833 | 13.3% | 27.7 | 5.6% | 43.4% | 57.2% | 15.1% |
| 43 | Santa Ana, CA | 312,534 | 12.2% | 24.5 | 4.8% | 42.9% | 44.6% | 10.8% |
| 44 | Austin, TX | 979,539 | 12.3% | 23.7 | 4.7% | 41.6% | 43.4% | 12.0% |
| 45 | Aurora, CO | 394,432 | 13.6% | 28.6 | 5.9% | 45.7% | 62.4% | 11.9% |
| 46 | Arlington, TX | 397,742 | 18.9% | 26.6 | 5.7% | 44.8% | 54.3% | 12.9% |
| 47 | Portland, OR | 641,165 | 5.2% | 24.1 | 5.8% | 39.5% | 52.0% | 12.7% |
| 48 | Tulsa, OK | 413,794 | 16.0% | 18.9 | 6.1% | 41.4% | 51.9% | 18.7% |
| 49 | El Paso, TX | 680,130 | 20.5% | 23.4 | 6.0% | 44.4% | 60.8% | 18.4% |
| 50 | Phoenix, AZ | 1,642,323 | 14.3% | 25.6 | 5.0% | 41.9% | 57.3% | 13.7% |
| 51 | Lubbock, TX | 264,814 | 13.6% | 16.3 | 5.2% | 40.4% | 51.2% | 18.9% |
| 52 | Seattle, WA | 754,195 | 4.1% | 26.0 | 4.6% | 40.1% | 43.7% | 9.9% |
| 53 | Toledo, OH | 267,463 | 5.7% | 19.8 | 7.7% | 32.5% | 53.3% | 24.3% |
| 54 | Nashville, TN | 690,130 | 12.7% | 24.7 | 4.5% | 41.3% | 52.4% | 14.1% |
| 55 | Bakersfield, CA | 411,986 | 7.4% | 23.6 | 7.0% | 45.4% | 60.6% | 16.3% |
| 56 | Greensboro, NC | 301,198 | 8.4% | 21.7 | 5.1% | 36.4% | 50.5% | 17.0% |
| 57 | San Diego, CA | 1,389,526 | 5.8% | 23.5 | 6.0% | 44.3% | 47.3% | 11.0% |
| 58 | Reno, NV | 273,212 | 10.6% | 20.3 | 5.1% | 41.2% | 49.8% | 12.6% |
| 59 | Winston-Salem, NC | 252,037 | 11.2% | 21.5 | 5.7% | 40.2% | 55.6% | 17.7% |
| 60 | Charlotte, NC | 903,844 | 12.8% | 24.7 | 4.6% | 40.7% | 51.0% | 11.7% |
| 61 | Irvine, CA | 311,690 | 4.0% | 24.7 | 5.9% | 50.1% | 44.5% | 10.8% |
| 62 | Chula Vista, CA | 276,375 | 6.3% | 28.6 | 8.0% | 50.2% | 59.8% | 8.7% |
| 63 | Fort Worth, TX | 963,194 | 18.5% | 27.1 | 4.8% | 45.8% | 57.0% | 13.1% |
| 64 | Irving, TX | 256,492 | 22.3% | 24.1 | 4.5% | 50.2% | 38.1% | 11.0% |
| 65 | St. Petersburg, FL | 262,732 | 10.0% | 25.6 | 4.7% | 40.0% | 62.8% | 12.5% |
| 66 | Garland, TX | 246,844 | 25.0% | 29.7 | 4.8% | 49.7% | 61.6% | 13.0% |
| 67 | Raleigh, NC | 481,031 | 9.3% | 23.0 | 4.4% | 40.5% | 50.7% | 11.9% |
| 68 | Corpus Christi, TX | 317,419 | 17.7% | 21.3 | 5.1% | 44.8% | 57.9% | 17.1% |
| 69 | Laredo, TX | 257,619 | 27.2% | 21.6 | 5.4% | 45.5% | 64.1% | 20.9% |
| 70 | St. Paul, MN | 307,284 | 6.6% | 21.1 | 5.4% | 37.4% | 52.9% | 15.6% |
| 71 | Indianapolis, IN | 885,860 | 8.8% | 24.6 | 5.1% | 40.7% | 56.0% | 15.8% |
| 72 | Jacksonville, FL | 977,670 | 11.2% | 24.1 | 4.6% | 42.2% | 57.6% | 14.5% |
| 73 | Albuquerque, NM | 562,218 | 8.5% | 22.4 | 5.4% | 38.6% | 61.8% | 15.5% |
| 74 | Port St. Lucie, FL | 232,491 | 10.3% | 30.5 | 6.0% | 51.9% | 84.0% | 9.5% |
| 75 | San Jose, CA | 990,138 | 4.8% | 27.3 | 5.1% | 49.1% | 55.8% | 8.1% |
| 76 | Kansas City, MO | 510,612 | 11.0% | 21.7 | 4.4% | 40.5% | 55.4% | 14.6% |
| 77 | Madison, WI | 278,001 | 4.2% | 19.4 | 2.7% | 37.1% | 46.0% | 16.4% |
| 78 | Louisville, KY | 631,818 | 6.0% | 22.5 | 5.5% | 41.3% | 60.7% | 15.8% |
| 79 | Durham, NC | 291,467 | 10.7% | 22.3 | 3.8% | 41.3% | 52.3% | 11.7% |
| 80 | Henderson, NV | 332,141 | 6.7% | 24.3 | 6.8% | 50.6% | 66.1% | 9.0% |
| 81 | Santa Clarita, CA | 230,221 | 4.6% | 34.1 | 5.6% | 53.1% | 71.8% | 7.4% |
| 82 | Fort Wayne, IN | 268,589 | 9.4% | 21.5 | 5.6% | 42.3% | 61.9% | 16.0% |
| 83 | Oklahoma City, OK | 697,125 | 13.7% | 22.2 | 4.7% | 46.5% | 58.6% | 15.1% |
| 84 | Wichita, KS | 397,945 | 12.4% | 18.4 | 5.6% | 44.9% | 58.9% | 15.9% |
| 85 | Lexington, KY | 323,725 | 7.2% | 20.9 | 4.9% | 42.9% | 53.8% | 14.9% |
| 86 | Plano, TX | 290,594 | 10.6% | 25.4 | 4.0% | 55.8% | 56.9% | 6.8% |
| 87 | Spokane, WA | 230,293 | 5.4% | 20.6 | 5.7% | 41.7% | 58.8% | 13.8% |
| 88 | Fremont, CA | 228,295 | 2.5% | 30.3 | 4.7% | 61.5% | 60.8% | 5.2% |
| 89 | Colorado Springs, CO | 487,887 | 7.7% | 22.7 | 5.6% | 51.1% | 60.9% | 9.0% |
| 90 | Mesa, AZ | 511,764 | 10.6% | 24.7 | 4.2% | 47.8% | 64.4% | 10.3% |
| 91 | Omaha, NE | 488,837 | 9.2% | 19.6 | 4.2% | 44.7% | 57.4% | 13.5% |
| 92 | Chesapeake, VA | 252,583 | 5.8% | 25.8 | 4.9% | 52.1% | 74.4% | 9.4% |
| 93 | Anchorage, AK | 288,976 | 9.8% | 18.8 | 4.6% | 47.6% | 63.9% | 8.9% |
| 94 | Huntsville, AL | 222,791 | 9.0% | 19.7 | 4.1% | 42.0% | 58.3% | 12.6% |
| 95 | Gilbert, AZ | 280,262 | 6.3% | 25.9 | 3.5% | 56.8% | 73.1% | 5.3% |
| 96 | Chandler, AZ | 280,136 | 6.5% | 23.9 | 3.6% | 50.3% | 65.0% | 7.9% |
| 97 | Virginia Beach, VA | 456,349 | 6.3% | 23.4 | 4.0% | 49.9% | 65.1% | 8.6% |
| 98 | Lincoln, NE | 294,856 | 6.3% | 18.4 | 3.3% | 45.4% | 56.1% | 12.7% |
| 99 | Scottsdale, AZ | 243,821 | 5.1% | 21.6 | 3.6% | 50.5% | 67.0% | 7.3% |
| 100 | Boise, ID | 237,242 | 7.0% | 18.9 | 3.6% | 46.0% | 63.2% | 10.6% |
Source: U.S. Census Bureau American Community Survey 2020-2024; HomeSnacks cost of living index. The 100 largest US cities.
Summary
Summary: The Most Miserable Cities In The US
Trying to decide which cities are the most miserable is usually a subjective exercise. But if you’re looking for cities where people are stuck in traffic, struggling to pay the rent, uninsured, and out of work, this is an accurate list.
The most miserable cities in the United States for 2026 are Newark, NJ, Los Angeles, CA, New York, NY, Miami, FL, Houston, TX, Chicago, IL, Long Beach, CA, Boston, MA, Atlanta, GA, and Philadelphia, PA.
Notice that money alone doesn’t fix it. Boston and Long Beach have some of the higher incomes on this list, but they also have long commutes, sky-high costs, and a lot of people who will probably never own a home.
Questions and answers
Most Miserable Cities In America FAQs
What is the most miserable city in America?
Newark, NJ is the most miserable city in America for 2026, according to Saturday Night Science. Los Angeles and New York are next.
What are the 10 most miserable cities in the US?
The ten most miserable big cities in the United States for 2026 are Newark, NJ, Los Angeles, CA, New York, NY, Miami, FL, Houston, TX, Chicago, IL, Long Beach, CA, Boston, MA, Atlanta, GA, and Philadelphia, PA.
What is the happiest big city in America?
Boise, ID is the happiest of the 100 biggest cities in America, according to our Miserable Index.
How did you measure misery?
We ranked the 100 largest US cities on seven measures: health insurance, commute time, unemployment, cost of living, marriage rates, homeownership, and poverty, then averaged the rankings.