
Most Hispanic/Latino cities in the United States research summary. We used Saturday Night Science to research the cities with the highest percentage of Hispanic/Latino residents for 2025. The data comes from the American Community Survey 2019-2023 vintage, which breaks down race by origin.
-
The city with the highest percentage of Hispanic Americans is East Los Angeles, CA. 95.58% of people in East Los Angeles, CA are Hispanic.
-
The city with the lowest percentage of Hispanic Americans is Jackson, MS. 2.24% of people in Jackson, MS are Hispanic.
-
The city with the most Hispanic Americans is New York, NY. 2,420,539 people in New York, NY are Hispanic.
-
The city with the fewest Hispanic Americans is Sterling Heights, MI. 3,243 people in Sterling Heights, MI are Hispanic.
-
The United States has 63,131,589 Hispanic Americans and is 18.99% Hispanic.
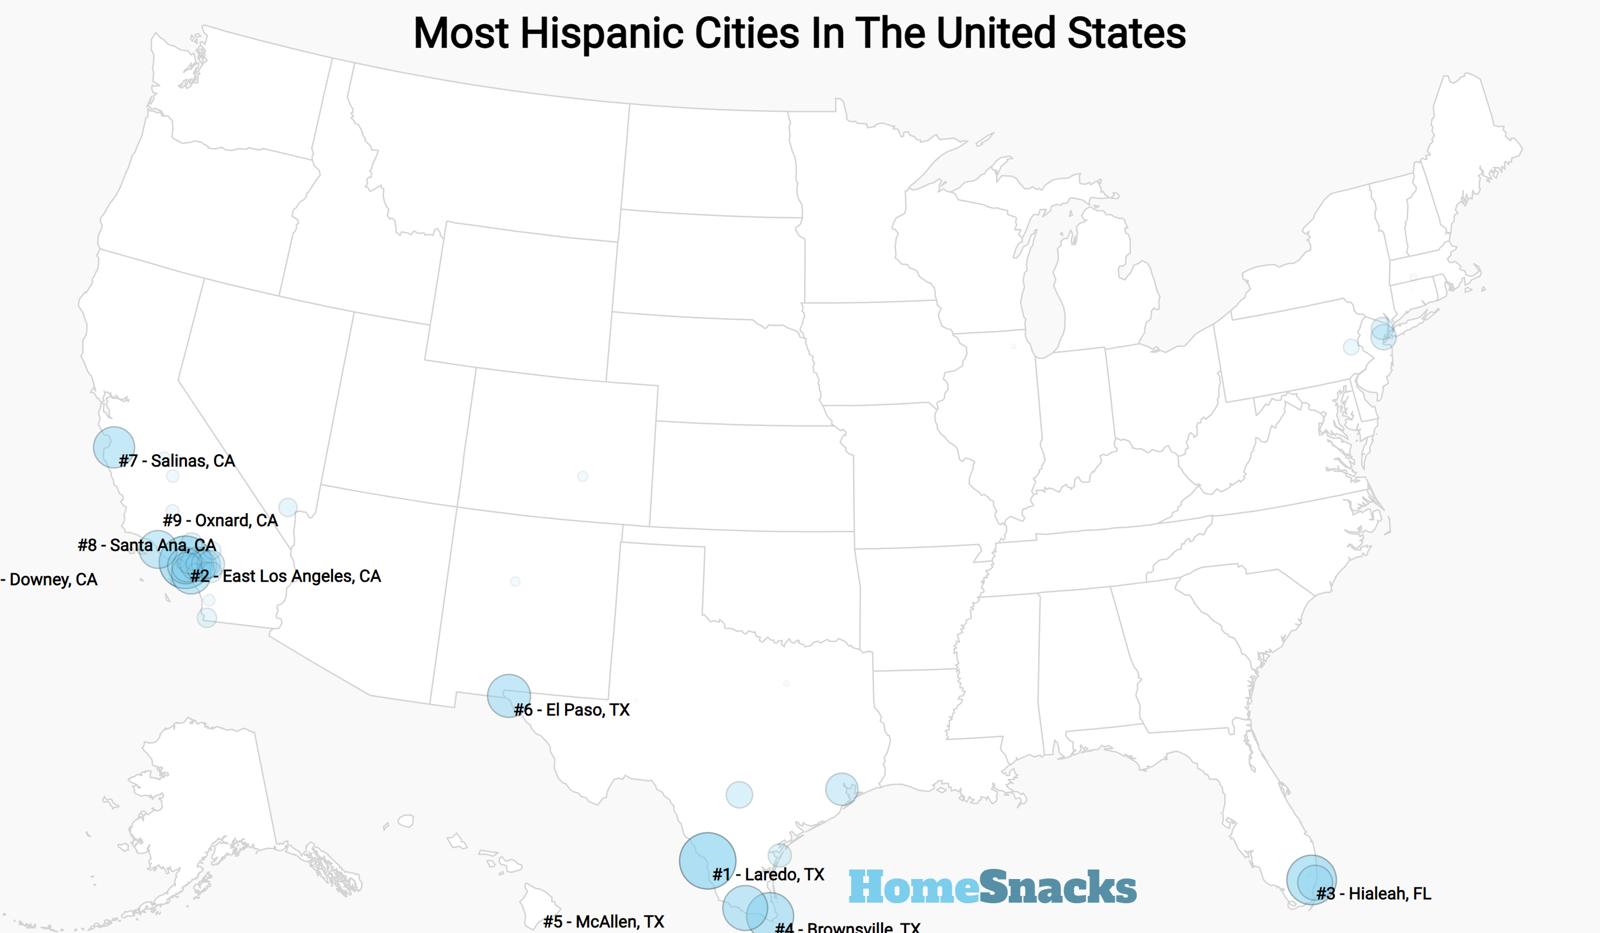
Table Of Contents: Top Ten | Methodology | Summary | Table
The 10 Cities In America With The Largest Hispanic Population
So, what’s the big city in America with largest percentage of Hispanics according to the data? Per the most recent ACS data, the city in America with the largest Hispanic population is East Los Angeles, CA.
There has been a slow and steady increase in the Hispanic population across America over the past several decades.
Starting on the coasts and moving inland, Hispanic Americans have found homes in every city and town in America. Now, according to the most recent Census data, 18.99% of people living in the US are Hispanic, which is up from 2010.
Or if you’re ready to move on to another ranking of American cities and states, check out:
The 10 Cities In America With The Largest Hispanic Population For 2025

/10
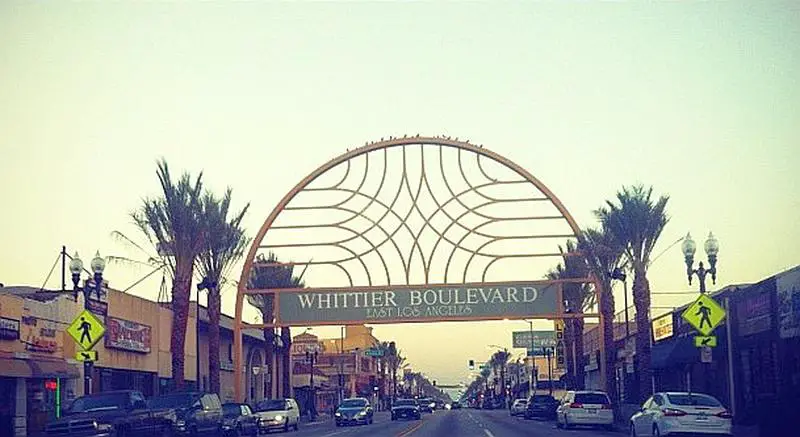
Population: 114,617
Hispanic Population: 109,553
Percent Hispanic American: 95.6%
Percent Hispanic American 2010: 97.8%
Percent Change: -9.0%
More on East Los Angeles: Data | Real Estate

/10
Population: 221,901
Hispanic Population: 211,340
Percent Hispanic American: 95.2%
Percent Hispanic American 2010: 95.6%
Percent Change: -1.4%
More on Hialeah: Data | Real Estate

I live in Hialeah and I don’t think it’s that bad !,!,!,


/10
Population: 255,949
Hispanic Population: 243,667
Percent Hispanic American: 95.2%
Percent Hispanic American 2010: 95.3%
Percent Change: 13.0%
More on Laredo: Data | Real Estate


/10
Population: 188,023
Hispanic Population: 177,146
Percent Hispanic American: 94.2%
Percent Hispanic American 2010: 93.2%
Percent Change: 12.1%
More on Brownsville: Data | Real Estate

/10
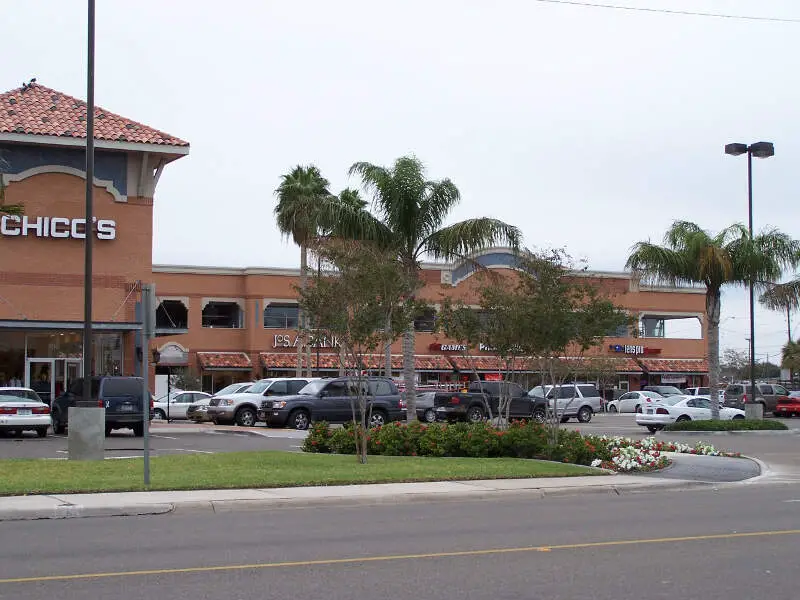
Population: 143,789
Hispanic Population: 124,436
Percent Hispanic American: 86.5%
Percent Hispanic American 2010: 82.9%
Percent Change: 19.5%
More on Mcallen: Data | Real Estate
I live in Mcallen next to RIO GRANDE CITY and Mcallen is so beautiful.Just come here and see for yourself.Mercades may be a bit yuck but it’s really cool.Donna is cool as well.No hate,just telling you.

/10
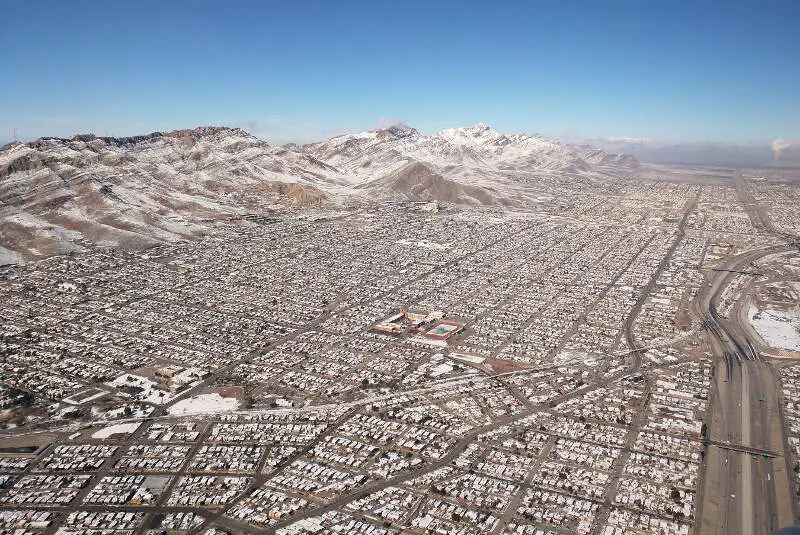
Population: 678,147
Hispanic Population: 551,539
Percent Hispanic American: 81.3%
Percent Hispanic American 2010: 80.3%
Percent Change: 9.2%
More on El Paso: Data | Real Estate
I live in El Paso m8 and I love it here

/10
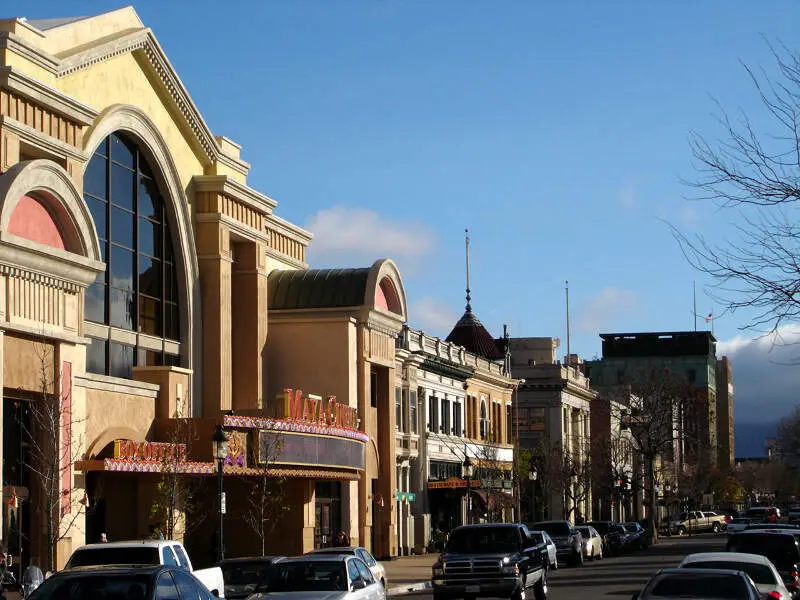
Population: 161,993
Hispanic Population: 130,015
Percent Hispanic American: 80.3%
Percent Hispanic American 2010: 74.1%
Percent Change: 19.4%
More on Salinas: Data | Real Estate


/10
Population: 311,639
Hispanic Population: 240,772
Percent Hispanic American: 77.3%
Percent Hispanic American 2010: 78.1%
Percent Change: -5.2%
More on Santa Ana: Data | Real Estate


/10
Population: 201,014
Hispanic Population: 154,854
Percent Hispanic American: 77.0%
Percent Hispanic American 2010: 70.2%
Percent Change: 14.6%
More on Oxnard: Data | Real Estate
I love this town because there’s always something to do! Weather it’s going to the beach or walking your dogs at the park, you can always find entertainment.
Whenever I try out a new place to eat or store to go, the staff is always friendly an they make me feel welcome.

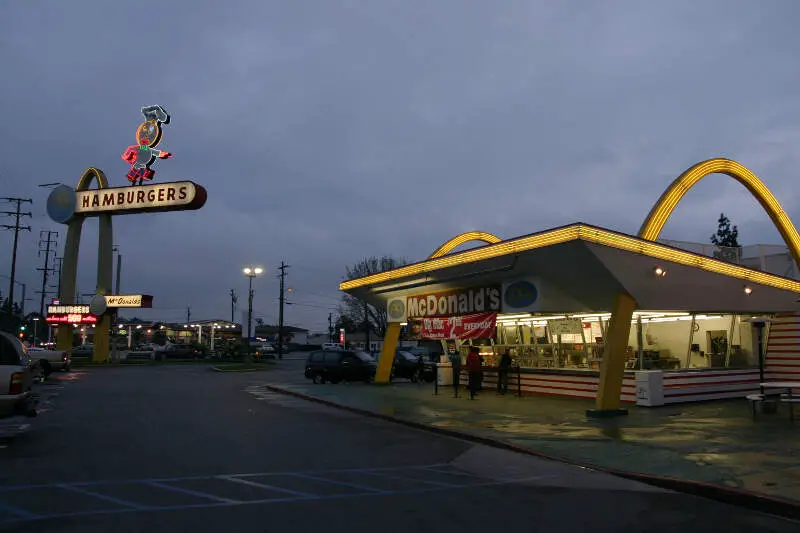
/10
Population: 111,793
Hispanic Population: 84,134
Percent Hispanic American: 75.3%
Percent Hispanic American 2010: 69.5%
Percent Change: 9.1%
More on Downey: Data | Real Estate
How We Determined The Most Hispanic Large Cities in The US
When we analyze the demographics of a city, we simply look at statistics. In particular, we use Saturday Night Science to compare the recently released 2019-2023 American Community Survey for a detailed breakdown of race by city.
Specifically, we looked at table B03002, which has the breakdown of people by Hispanic/Latino and race.
Limiting our analysis to only cities greater than 100,000 people, we looked at the percentage of the population of each city that identified as non-Hispanic/Latino, Hispanic.
We then ranked each city from 1 to 271 in terms of that percentage, with the city having the highest overall percentage being named the “City In America with the Largest Hispanic American population” — East Los Angeles, CA, . We updated this article for 2025. This article is our tenth time ranking the cities in America with the highest Hispanic population.
The “least Hispanic American” city according to the data? That would be Jackson, MS, < which is only 2.2% Hispanic American as of the latest data.
There You Have It — The Most Hispanic Cities in America For 2025
There you have it, the cities in America with the largest Hispanic population for 2025 with East Los Angeles, CA taking the top spot.
We expect the Hispanic population in America to keep increasing in the coming years. So it wonât be a surprise to you or us if these percentages get bigger next year.
The cities in the United States with the largest hispanic population are East Los Angeles, CA, Hialeah, FL, Laredo, TX, Brownsville, TX, Mcallen, TX, El Paso, TX, Salinas, CA, Santa Ana, CA, Oxnard, CA, and Downey, CA.
Here’s a look at the least hispanic cities in America:
- Jackson, MS
- Sterling Heights, MI
- Warren, MI
For more reading, check out:
Most Hispanic Cities In The United States For 2025
| Rank | City | Population | Hispanic Population | Percent Hispanic |
|---|---|---|---|---|
| 1 | East Los Angeles, CA | 114,617 | 109,553 | 95.6% |
| 2 | Hialeah, FL | 221,901 | 211,340 | 95.2% |
| 3 | Laredo, TX | 255,949 | 243,667 | 95.2% |
| 4 | Brownsville, TX | 188,023 | 177,146 | 94.2% |
| 5 | Mcallen, TX | 143,789 | 124,436 | 86.5% |
| 6 | El Paso, TX | 678,147 | 551,539 | 81.3% |
| 7 | Salinas, CA | 161,993 | 130,015 | 80.3% |
| 8 | Santa Ana, CA | 311,639 | 240,772 | 77.3% |
| 9 | Oxnard, CA | 201,014 | 154,854 | 77.0% |
| 10 | Downey, CA | 111,793 | 84,134 | 75.3% |
| 11 | Pomona, CA | 148,391 | 106,019 | 71.4% |
| 12 | Miami, FL | 446,663 | 317,968 | 71.2% |
| 13 | Pasadena, TX | 149,345 | 105,221 | 70.5% |
| 14 | San Bernardino, CA | 221,774 | 154,354 | 69.6% |
| 15 | Norwalk, CA | 100,713 | 69,976 | 69.5% |
| 16 | Ontario, CA | 178,347 | 121,756 | 68.3% |
| 17 | Fontana, CA | 211,921 | 143,825 | 67.9% |
| 18 | Elizabeth, NJ | 135,887 | 90,707 | 66.8% |
| 19 | El Monte, CA | 107,066 | 69,693 | 65.1% |
| 20 | San Antonio, TX | 1,458,954 | 939,737 | 64.4% |
| 21 | Paterson, NJ | 157,660 | 99,019 | 62.8% |
| 22 | Palmdale, CA | 165,487 | 103,865 | 62.8% |
| 23 | Corpus Christi, TX | 317,383 | 194,902 | 61.4% |
| 24 | Chula Vista, CA | 275,030 | 166,159 | 60.4% |
| 25 | Moreno Valley, CA | 210,378 | 125,572 | 59.7% |
| 26 | Victorville, CA | 135,983 | 75,139 | 55.3% |
| 27 | Sunrise Manor, NV | 199,099 | 109,170 | 54.8% |
| 28 | Riverside, CA | 316,241 | 172,687 | 54.6% |
| 29 | Allentown, PA | 125,320 | 67,461 | 53.8% |
| 30 | Bakersfield, CA | 408,366 | 218,809 | 53.6% |
| 31 | West Covina, CA | 107,436 | 57,147 | 53.2% |
| 32 | Anaheim, CA | 344,553 | 180,976 | 52.5% |
| 33 | Escondido, CA | 149,913 | 77,549 | 51.7% |
| 34 | Visalia, CA | 142,649 | 73,691 | 51.7% |
| 35 | Fresno, CA | 543,615 | 274,817 | 50.6% |
| 36 | Inglewood, CA | 105,575 | 51,677 | 48.9% |
| 37 | Elgin, IL | 114,106 | 55,251 | 48.4% |
| 38 | Pueblo, CO | 111,514 | 53,958 | 48.4% |
| 39 | Corona, CA | 158,839 | 76,665 | 48.3% |
| 40 | Albuquerque, NM | 562,488 | 269,483 | 47.9% |
| 41 | Pembroke Pines, FL | 170,557 | 81,530 | 47.8% |
| 42 | Springfield, MA | 154,751 | 73,362 | 47.4% |
| 43 | Los Angeles, CA | 3,857,897 | 1,822,163 | 47.2% |
| 44 | Grand Prairie, TX | 198,564 | 93,709 | 47.2% |
| 45 | Richmond, CA | 115,396 | 54,169 | 46.9% |
| 46 | Lancaster, CA | 170,013 | 78,027 | 45.9% |
| 47 | Stockton, CA | 320,470 | 144,800 | 45.2% |
| 48 | Garland, TX | 245,298 | 110,306 | 45.0% |
| 49 | Hartford, CT | 119,970 | 53,687 | 44.8% |
| 50 | Mesquite, TX | 148,848 | 66,479 | 44.7% |
| 51 | Bridgeport, CT | 148,012 | 66,017 | 44.6% |
| 52 | Yonkers, NY | 209,529 | 93,044 | 44.4% |
| 53 | Providence, RI | 190,214 | 84,213 | 44.3% |
| 54 | Midland, TX | 133,998 | 59,306 | 44.3% |
| 55 | Houston, TX | 2,300,419 | 1,013,768 | 44.1% |
| 56 | Modesto, CA | 218,614 | 95,987 | 43.9% |
| 57 | Long Beach, CA | 458,491 | 199,087 | 43.4% |
| 58 | Irving, TX | 255,036 | 109,552 | 43.0% |
| 59 | Hollywood, FL | 152,935 | 65,575 | 42.9% |
| 60 | Aurora, IL | 179,867 | 76,910 | 42.8% |
| 61 | Tucson, AZ | 543,348 | 232,048 | 42.7% |
| 62 | West Valley City, UT | 137,955 | 58,607 | 42.5% |
| 63 | Dallas, TX | 1,299,553 | 545,002 | 41.9% |
| 64 | Phoenix, AZ | 1,624,832 | 678,869 | 41.8% |
| 65 | North Las Vegas, NV | 270,773 | 111,827 | 41.3% |
| 66 | Hayward, CA | 159,201 | 65,119 | 40.9% |
| 67 | Glendale, AZ | 250,193 | 101,405 | 40.5% |
| 68 | Orange, CA | 138,723 | 55,464 | 40.0% |
| 69 | Fullerton, CA | 141,278 | 55,900 | 39.6% |
| 70 | Oceanside, CA | 172,542 | 66,506 | 38.5% |
| 71 | Rancho Cucamonga, CA | 174,693 | 67,162 | 38.4% |
| 72 | Miramar, FL | 135,986 | 52,076 | 38.3% |
| 73 | Garden Grove, CA | 170,603 | 64,171 | 37.6% |
| 74 | Waterbury, CT | 114,356 | 42,895 | 37.5% |
| 75 | Thornton, CO | 142,878 | 53,497 | 37.4% |
| 76 | Newark, NJ | 307,188 | 114,280 | 37.2% |
| 77 | Lubbock, TX | 261,078 | 95,937 | 36.7% |
| 78 | Costa Mesa, CA | 110,538 | 40,190 | 36.4% |
| 79 | Santa Clarita, CA | 229,021 | 82,543 | 36.0% |
| 80 | Santa Rosa, CA | 177,216 | 63,367 | 35.8% |
| 81 | San Buenaventura (Ventura), CA | 109,900 | 39,187 | 35.7% |
| 82 | Orlando, FL | 311,732 | 111,025 | 35.6% |
| 83 | Kansas City, KS | 154,776 | 54,184 | 35.0% |
| 84 | Joliet, IL | 149,785 | 51,970 | 34.7% |
| 85 | Fort Worth, TX | 941,311 | 326,004 | 34.6% |
| 86 | Paradise, NV | 186,178 | 64,469 | 34.6% |
| 87 | Las Vegas, NV | 650,873 | 222,149 | 34.1% |
| 88 | Pasadena, CA | 136,462 | 46,562 | 34.1% |
| 89 | Amarillo, TX | 200,945 | 67,731 | 33.7% |
| 90 | Miami Gardens, FL | 111,264 | 37,383 | 33.6% |
| 91 | Concord, CA | 124,260 | 40,118 | 32.3% |
| 92 | Austin, TX | 967,862 | 311,890 | 32.2% |
| 93 | Carrollton, TX | 132,741 | 42,259 | 31.8% |
| 94 | Fairfield, CA | 119,985 | 38,135 | 31.8% |
| 95 | New Haven, CT | 132,893 | 41,503 | 31.2% |
| 96 | Arlington, TX | 394,769 | 122,467 | 31.0% |
| 97 | San Jose, CA | 990,054 | 306,450 | 31.0% |
| 98 | Aurora, CO | 390,201 | 119,603 | 30.7% |
| 99 | Coral Springs, FL | 133,962 | 40,714 | 30.4% |
| 100 | Vallejo, CA | 124,637 | 37,390 | 30.0% |
Hispanic Places By State
Alaska Cities With The Largest Hispanic Population
Alabama Cities With The Largest Hispanic Population
Arkansas Cities With The Largest Hispanic Population
Arizona Cities With The Largest Hispanic Population
California Cities With The Largest Hispanic Population
Colorado Cities With The Largest Hispanic Population
Connecticut Cities With The Largest Hispanic Population
Delaware Cities With The Largest Hispanic Population
Florida Cities With The Largest Hispanic Population
Georgia Cities With The Largest Hispanic Population
Hawaii Cities With The Largest Hispanic Population
Iowa Cities With The Largest Hispanic Population
Idaho Cities With The Largest Hispanic Population
Illinois Cities With The Largest Hispanic Population
Indiana Cities With The Largest Hispanic Population
Louisiana Cities With The Largest Hispanic Population
Massachusetts Cities With The Largest Hispanic Population
Maryland Cities With The Largest Hispanic Population
Maine Cities With The Largest Hispanic Population
Michigan Cities With The Largest Hispanic Population
Minnesota Cities With The Largest Hispanic Population
Missouri Cities With The Largest Hispanic Population
Mississippi Cities With The Largest Hispanic Population
Montana Cities With The Largest Hispanic Population
North Carolina Cities With The Largest Hispanic Population
North Dakota Cities With The Largest Hispanic Population
Nebraska Cities With The Largest Hispanic Population
New Hampshire Cities With The Largest Hispanic Population
New Jersey Cities With The Largest Hispanic Population
New Mexico Cities With The Largest Hispanic Population
Ohio Cities With The Largest Hispanic Population
Oklahoma Cities With The Largest Hispanic Population
Oregon Cities With The Largest Hispanic Population
Pennsylvania Cities With The Largest Hispanic Population
Rhode Island Cities With The Largest Hispanic Population
South Carolina Cities With The Largest Hispanic Population
South Dakota Cities With The Largest Hispanic Population
Tennessee Cities With The Largest Hispanic Population
Texas Cities With The Largest Hispanic Population
Utah Cities With The Largest Hispanic Population
Virginia Cities With The Largest Hispanic Population
Vermont Cities With The Largest Hispanic Population
Washington Cities With The Largest Hispanic Population
Wisconsin Cities With The Largest Hispanic Population