
Most Asian cities in California research summary. We analyzed California’s most recent Census data to determine the most Asian cities in California based on the percentage of Asian residents. Here are the results of our analysis:
The most Asian city in California is Milpitas based on the most recent Census data.
Milpitas is 71.47% Asian.
The least Asian city in California is Huron.
Huron is 0.0% Asian.
California is 15.3% Asian.
California is the 2nd most Asian state in the United States.
Table Of Contents: Top Ten | Methodology | Summary | Table
Here are the cities in California with the largest Asian population in 2026:
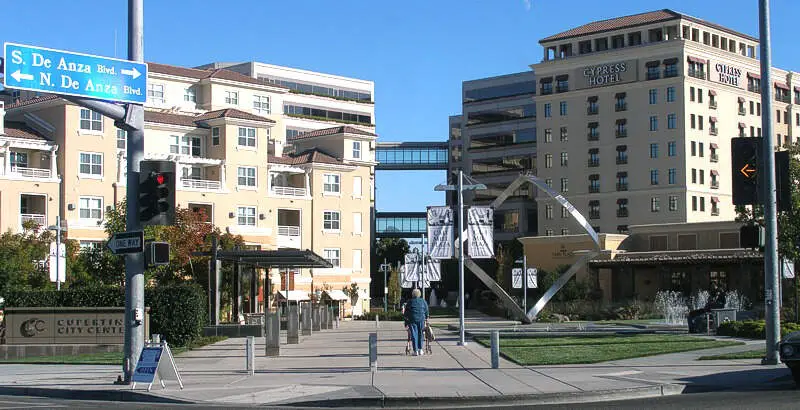
Which city in California had the largest Asian population? Milpitas took the number one overall spot for the largest Asian in California for 2026. 71.47% of Milpitas identify as Asian.
Read below to see how we crunched the numbers and how your town ranked.
To see where California ranked as a state on diversity, we have a ranking of the most diverse states in America.
And if you already knew these places were Asian, check out the best places to live in California or the most diverse places in California.
The 10 Most Asian Cities In California For 2026

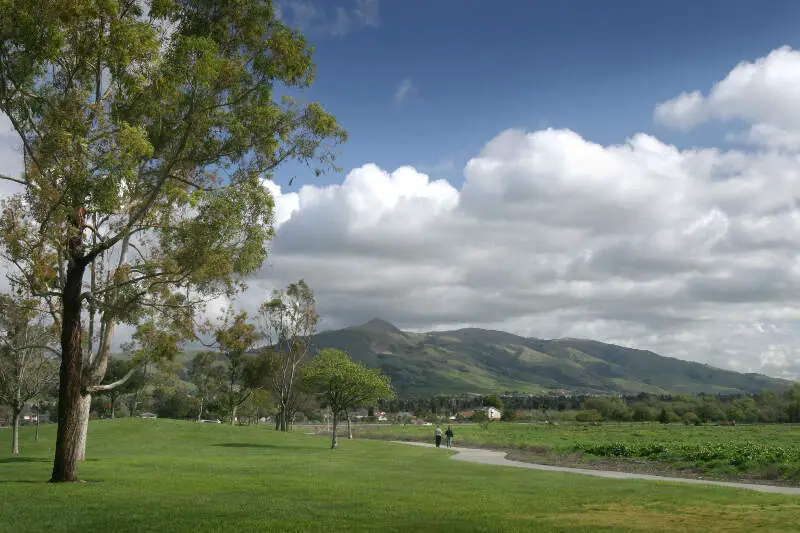
/10
Population: 78,578
% Asian: 71.47%
# Of Asian Residents: 56,160
More on Milpitas: Data | Crime | Cost Of Living | Movers

/10
Population: 58,566
% Asian: 70.83%
# Of Asian Residents: 41,483
More on Cupertino: Data | Crime | Cost Of Living | Movers


/10
Population: 27,611
% Asian: 68.75%
# Of Asian Residents: 18,982
More on Walnut: Data | Crime | Cost Of Living | Movers

/10
Population: 12,216
% Asian: 68.09%
# Of Asian Residents: 8,318
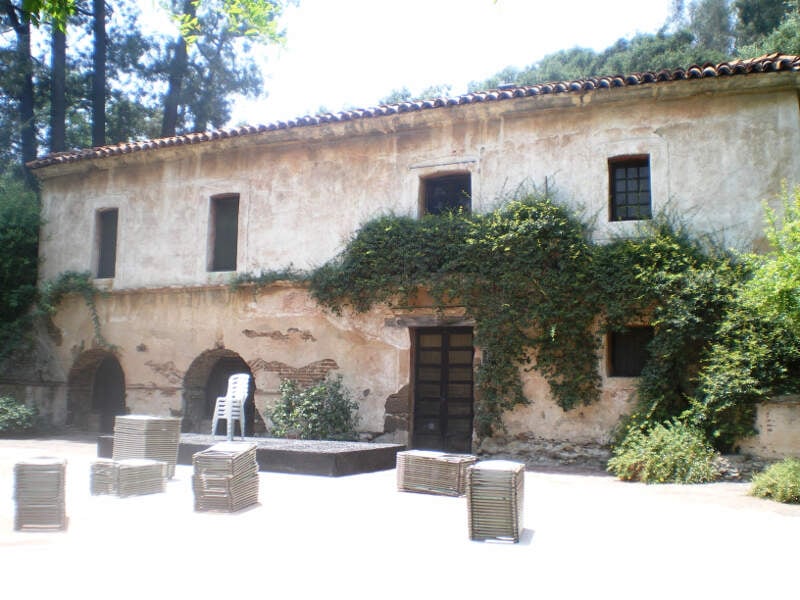
More on San Marino: Data | Crime | Cost Of Living | Movers

/10
Population: 50,013
% Asian: 65.75%
# Of Asian Residents: 32,885
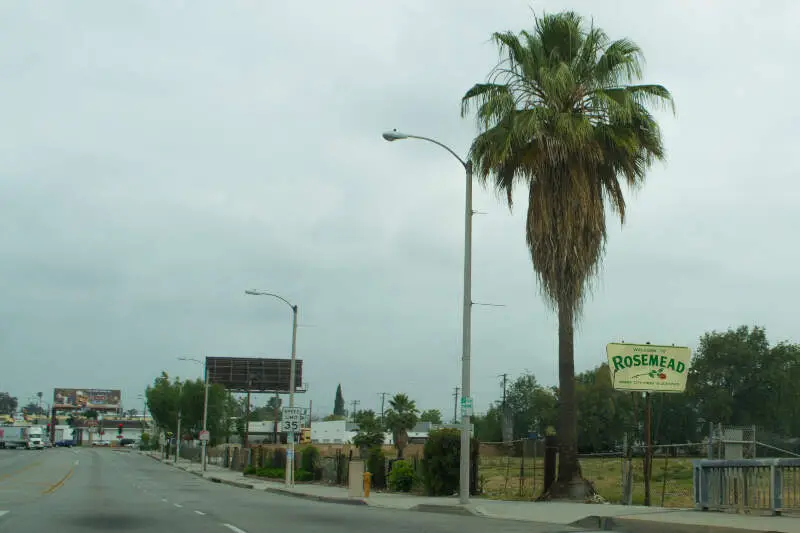
More on Rosemead: Data | Crime | Cost Of Living | Movers

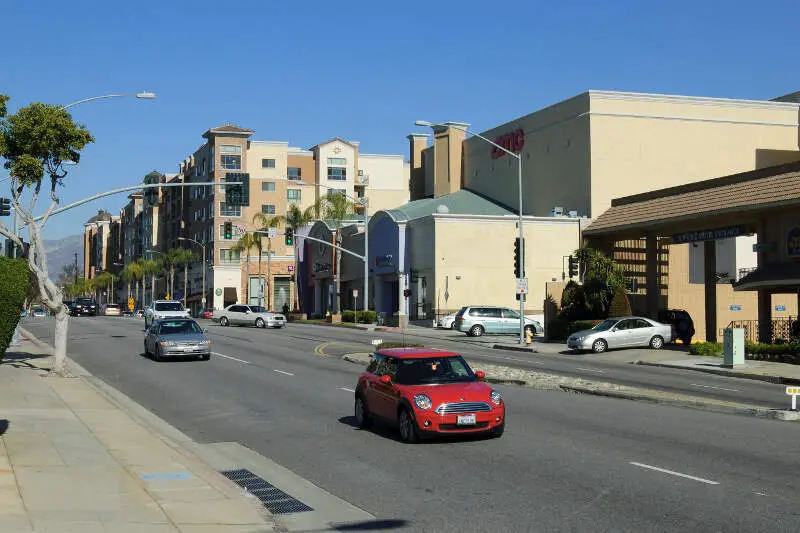
/10
Population: 59,132
% Asian: 64.4%
# Of Asian Residents: 38,083
More on Monterey Park: Data | Crime | Cost Of Living | Movers

/10
Population: 228,295
% Asian: 63.67%
# Of Asian Residents: 145,362
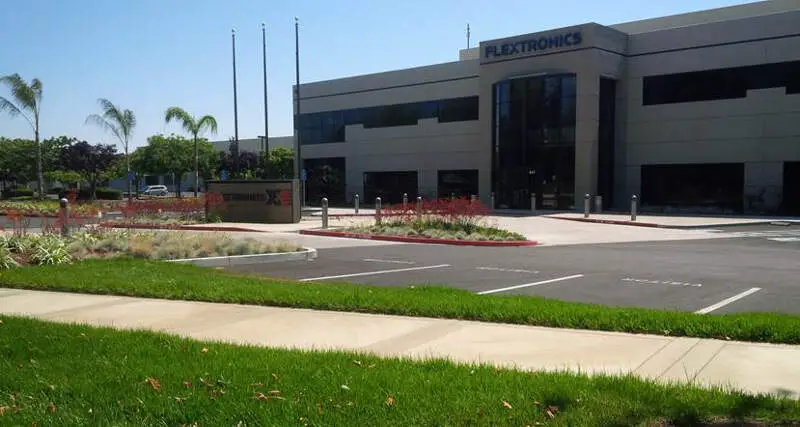
More on Fremont: Data | Crime | Cost Of Living | Movers

/10
Population: 35,430
% Asian: 63.34%
# Of Asian Residents: 22,440
More on Temple City: Data | Crime | Cost Of Living | Movers

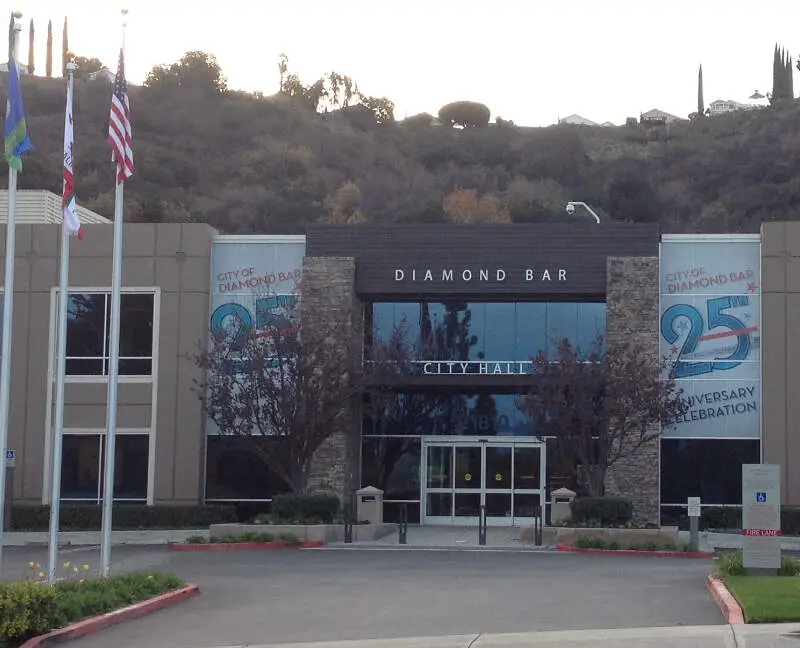
/10
Population: 53,355
% Asian: 62.44%
# Of Asian Residents: 33,316
More on Diamond Bar: Data | Crime | Cost Of Living | Movers

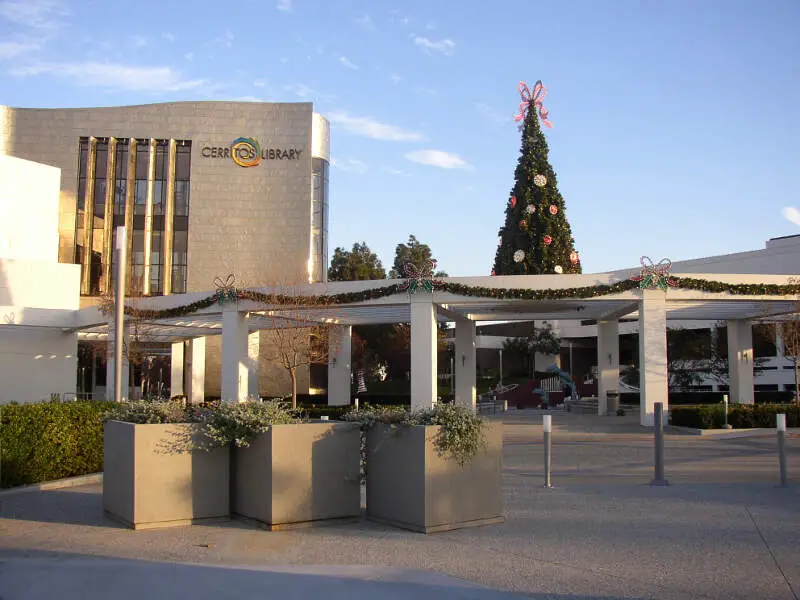
/10
Population: 47,867
% Asian: 61.66%
# Of Asian Residents: 29,516
More on Cerritos: Data | Crime | Cost Of Living | Movers
Methodology: How We Determined The Cities In California With The Largest Asian Population For 2026
We used Saturday Night Science to compare Census data on race across every place in California.
The Census’s most recently available data comes from the 2020-2024 American Community Survey.
Specifically, we looked at table B03002: Hispanic OR LATINO ORIGIN BY RACE. Here are the category names as defined by the Census:
- Hispanic or Latino
- White alone*
- Black or African American alone*
- American Indian and Alaska Native alone*
- Asian alone*
- Native Hawaiian and Other Pacific Islander alone*
- Some other race alone*
- Two or more races*
Our particular column of interest here was the number of people who identified as Asian alone.
We limited our analysis to cities with a population greater than 5,000 people. That left us with 421 cities.
We then calculated the percentage of residents that are Asian. The percentages ranked from 71.5% to 0.0%.
Finally, we ranked each city based on the percentage of Asian population, with a higher score being more Asian than a lower score. Milpitas took the distinction of being the most Asian, while Huron was the least Asian city.
We updated this article for 2026. This report reflects our eleventh time ranking the cities in California with the largest Asian population.
Read on for more information on how the cities in California ranked by population of Asian residents or, for a more general take on diversity in America, head over to our ranking of the most diverse cities in America.
Summary: Asian Populations Across California
If you’re looking for a breakdown of Asian populations across California according to the most recent data, this is an accurate list.
The most Asian cities in California are Milpitas, Cupertino, Walnut, San Marino, Rosemead, Monterey Park, Fremont, Temple City, Diamond Bar, and Cerritos.
If you’re curious enough, here are the least Asian places in California:
- Huron
- Arvin
- Cudahy
For more California reading, check out:
Table: Asian Population By City In California
| Rank | City | Population | Asian Population | % Asian |
|---|---|---|---|---|
| 1 | Milpitas | 78,578 | 56,160 | 71.47% |
| 2 | Cupertino | 58,566 | 41,483 | 70.83% |
| 3 | Walnut | 27,611 | 18,982 | 68.75% |
| 4 | San Marino | 12,216 | 8,318 | 68.09% |
| 5 | Rosemead | 50,013 | 32,885 | 65.75% |
| 6 | Monterey Park | 59,132 | 38,083 | 64.4% |
| 7 | Fremont | 228,295 | 145,362 | 63.67% |
| 8 | Temple City | 35,430 | 22,440 | 63.34% |
| 9 | Diamond Bar | 53,355 | 33,316 | 62.44% |
| 10 | Cerritos | 47,867 | 29,516 | 61.66% |
| 11 | San Gabriel | 38,392 | 22,862 | 59.55% |
| 12 | Saratoga | 30,319 | 18,035 | 59.48% |
| 13 | Daly City | 101,964 | 60,378 | 59.22% |
| 14 | Arcadia | 55,170 | 32,387 | 58.7% |
| 15 | Union City | 67,464 | 38,405 | 56.93% |
| 16 | Dublin | 70,803 | 38,963 | 55.03% |
| 17 | Foster City | 32,792 | 17,816 | 54.33% |
| 18 | La Palma | 15,272 | 8,258 | 54.07% |
| 19 | Westminster | 89,860 | 47,118 | 52.43% |
| 20 | Alhambra | 81,022 | 41,073 | 50.69% |
| 21 | Santa Clara | 130,256 | 65,424 | 50.23% |
| 22 | San Ramon | 85,993 | 42,573 | 49.51% |
| 23 | Sunnyvale | 154,236 | 76,137 | 49.36% |
| 24 | Millbrae | 22,689 | 10,914 | 48.1% |
| 25 | Newark | 46,903 | 21,703 | 46.27% |
| 26 | Irvine | 311,690 | 139,049 | 44.61% |
| 27 | Hercules | 26,302 | 11,593 | 44.08% |
| 28 | Pleasanton | 76,960 | 33,663 | 43.74% |
| 29 | Artesia | 15,889 | 6,859 | 43.17% |
| 30 | Garden Grove | 170,964 | 73,009 | 42.7% |
| 31 | South San Francisco | 64,305 | 26,867 | 41.78% |
| 32 | Los Altos Hills | 8,377 | 3,427 | 40.91% |
| 33 | Chino Hills | 77,927 | 31,710 | 40.69% |
| 34 | San Jose | 990,138 | 388,267 | 39.21% |
| 35 | Los Altos | 30,698 | 11,940 | 38.9% |
| 36 | Cypress | 49,498 | 18,867 | 38.12% |
| 37 | Palo Alto | 67,237 | 25,620 | 38.1% |
| 38 | Torrance | 142,130 | 52,585 | 37.0% |
| 39 | Fountain Valley | 56,258 | 20,654 | 36.71% |
| 40 | Mountain View | 83,732 | 30,382 | 36.28% |
| 41 | San Leandro | 87,826 | 31,421 | 35.78% |
| 42 | South Pasadena | 26,068 | 9,116 | 34.97% |
| 43 | San Francisco | 830,235 | 290,030 | 34.93% |
| 44 | Lathrop | 35,052 | 11,764 | 33.56% |
| 45 | Hillsborough | 11,099 | 3,680 | 33.16% |
| 46 | American Canyon | 21,691 | 7,131 | 32.88% |
| 47 | Buena Park | 82,871 | 26,635 | 32.14% |
| 48 | Rancho Palos Verdes | 40,864 | 12,975 | 31.75% |
| 49 | San Bruno | 42,307 | 13,281 | 31.39% |
| 50 | Emeryville | 13,081 | 4,105 | 31.38% |
| 51 | Albany | 19,414 | 6,049 | 31.16% |
| 52 | Elk Grove | 179,155 | 55,538 | 31.0% |
| 53 | West Covina | 107,037 | 32,890 | 30.73% |
| 54 | Belmont | 27,337 | 8,375 | 30.64% |
| 55 | Hayward | 158,801 | 47,633 | 30.0% |
| 56 | Burlingame | 30,525 | 8,912 | 29.2% |
| 57 | Alameda | 77,238 | 22,108 | 28.62% |
| 58 | El Cerrito | 25,994 | 7,368 | 28.35% |
| 59 | Loma Linda | 25,122 | 7,097 | 28.25% |
| 60 | San Mateo | 103,105 | 28,820 | 27.95% |
| 61 | Brea | 47,469 | 13,142 | 27.69% |
| 62 | El Monte | 106,109 | 29,024 | 27.35% |
| 63 | Pinole | 18,761 | 5,111 | 27.24% |
| 64 | Carson | 92,871 | 24,926 | 26.84% |
| 65 | Stanton | 39,402 | 10,516 | 26.69% |
| 66 | Yorba Linda | 67,170 | 17,858 | 26.59% |
| 67 | Tustin | 78,981 | 20,669 | 26.17% |
| 68 | Campbell | 42,781 | 11,033 | 25.79% |
| 69 | Gardena | 59,422 | 15,206 | 25.59% |
| 70 | Fullerton | 140,968 | 34,646 | 24.58% |
| 71 | Rolling Hills Estates | 8,131 | 1,996 | 24.55% |
| 72 | Palos Verdes Estates | 12,925 | 3,167 | 24.5% |
| 73 | Davis | 66,978 | 16,223 | 24.22% |
| 74 | San Carlos | 29,614 | 6,938 | 23.43% |
| 75 | Tracy | 96,966 | 22,460 | 23.16% |
| 76 | Laguna Woods | 17,289 | 3,949 | 22.84% |
| 77 | Vallejo | 124,268 | 28,197 | 22.69% |
| 78 | Signal Hill | 11,468 | 2,588 | 22.57% |
| 79 | Moraga | 16,769 | 3,709 | 22.12% |
| 80 | Baldwin Park | 70,138 | 15,340 | 21.87% |
| 81 | Pacifica | 37,261 | 8,102 | 21.74% |
| 82 | Livingston | 14,606 | 3,169 | 21.7% |
| 83 | La Mirada | 47,180 | 10,008 | 21.21% |
| 84 | Danville | 43,401 | 9,186 | 21.17% |
| 85 | Stockton | 322,326 | 66,946 | 20.77% |
| 86 | Live Oak | 9,347 | 1,936 | 20.71% |
| 87 | Los Gatos | 32,786 | 6,738 | 20.55% |
| 88 | South El Monte | 19,287 | 3,953 | 20.5% |
| 89 | Berkeley | 120,257 | 24,473 | 20.35% |
| 90 | Yuba City | 69,471 | 14,047 | 20.22% |
| 91 | La Habra Heights | 5,478 | 1,103 | 20.14% |
| 92 | Sacramento | 528,706 | 106,143 | 20.08% |
| 93 | Piedmont | 10,945 | 2,191 | 20.02% |
| 94 | Folsom | 83,916 | 16,696 | 19.9% |
| 95 | Culver City | 39,931 | 7,910 | 19.81% |
| 96 | Villa Park | 5,748 | 1,131 | 19.68% |
| 97 | Lake Forest | 86,281 | 16,970 | 19.67% |
| 98 | Pittsburg | 76,257 | 14,835 | 19.45% |
| 99 | Menlo Park | 32,727 | 6,133 | 18.74% |
| 100 | Suisun City | 29,286 | 5,448 | 18.6% |
| 101 | Placentia | 52,826 | 9,708 | 18.38% |
| 102 | Chino | 92,652 | 16,893 | 18.23% |
| 103 | Redwood City | 82,447 | 14,838 | 18.0% |
| 104 | Anaheim | 344,521 | 61,937 | 17.98% |
| 105 | Atherton | 6,993 | 1,256 | 17.96% |
| 106 | Duarte | 22,184 | 3,961 | 17.86% |
| 107 | Fairfield | 120,785 | 21,565 | 17.85% |
| 108 | Redondo Beach | 69,291 | 12,042 | 17.38% |
| 109 | San Diego | 1,389,526 | 240,003 | 17.27% |
| 110 | Lomita | 20,225 | 3,469 | 17.15% |
| 111 | Los Alamitos | 11,794 | 2,022 | 17.14% |
| 112 | Sierra Madre | 10,940 | 1,875 | 17.14% |
| 113 | Morgan Hill | 45,425 | 7,755 | 17.07% |
| 114 | Walnut Creek | 70,088 | 11,956 | 17.06% |
| 115 | Livermore | 85,522 | 14,581 | 17.05% |
| 116 | Lakewood | 79,850 | 13,589 | 17.02% |
| 117 | Pasadena | 136,969 | 23,270 | 16.99% |
| 118 | National City | 58,893 | 9,862 | 16.75% |
| 119 | Pleasant Hill | 34,235 | 5,688 | 16.61% |
| 120 | Aliso Viejo | 51,113 | 8,429 | 16.49% |
| 121 | San Dimas | 33,789 | 5,514 | 16.32% |
| 122 | Laguna Hills | 30,740 | 4,925 | 16.02% |
| 123 | Orinda | 19,514 | 3,115 | 15.96% |
| 124 | Oakland | 439,418 | 68,848 | 15.67% |
| 125 | Manteca | 89,043 | 13,926 | 15.64% |
| 126 | Monrovia | 37,571 | 5,871 | 15.63% |
| 127 | Brentwood | 65,208 | 10,001 | 15.34% |
| 128 | Azusa | 49,031 | 7,364 | 15.02% |
| 129 | Rancho Cucamonga | 175,411 | 26,332 | 15.01% |
| 130 | San Pablo | 31,720 | 4,695 | 14.8% |
| 131 | Rancho Cordova | 81,849 | 12,035 | 14.7% |
| 132 | Claremont | 36,595 | 5,255 | 14.36% |
| 133 | Mission Viejo | 92,151 | 13,069 | 14.18% |
| 134 | Chula Vista | 276,375 | 39,180 | 14.18% |
| 135 | Fresno | 545,970 | 77,355 | 14.17% |
| 136 | Seal Beach | 24,722 | 3,459 | 13.99% |
| 137 | Montebello | 61,045 | 8,516 | 13.95% |
| 138 | Antioch | 116,477 | 16,188 | 13.9% |
| 139 | Orange | 138,266 | 19,090 | 13.81% |
| 140 | Concord | 124,035 | 17,044 | 13.74% |
| 141 | La Puente | 37,142 | 5,082 | 13.68% |
| 142 | La Habra | 61,970 | 8,451 | 13.64% |
| 143 | Richmond | 115,505 | 15,717 | 13.61% |
| 144 | Beverly Hills | 31,624 | 4,264 | 13.48% |
| 145 | Covina | 49,888 | 6,681 | 13.39% |
| 146 | Manhattan Beach | 34,210 | 4,561 | 13.33% |
| 147 | Clovis | 124,725 | 16,591 | 13.3% |
| 148 | Roseville | 155,955 | 20,442 | 13.11% |
| 149 | West Sacramento | 54,927 | 7,164 | 13.04% |
| 150 | Huntington Beach | 195,240 | 25,320 | 12.97% |
| 151 | Norwalk | 99,789 | 12,876 | 12.9% |
| 152 | Delano | 51,679 | 6,636 | 12.84% |
| 153 | Glendale | 190,748 | 24,369 | 12.78% |
| 154 | Marina | 22,563 | 2,874 | 12.74% |
| 155 | Long Beach | 455,548 | 58,012 | 12.73% |
| 156 | Clayton | 10,937 | 1,387 | 12.68% |
| 157 | Hawaiian Gardens | 13,691 | 1,705 | 12.45% |
| 158 | Rancho Santa Margarita | 46,990 | 5,839 | 12.43% |
| 159 | Poway | 48,713 | 5,999 | 12.31% |
| 160 | Santa Ana | 312,534 | 38,460 | 12.31% |
| 161 | Santa Clarita | 230,221 | 27,662 | 12.02% |
| 162 | Los Angeles | 3,857,263 | 460,422 | 11.94% |
| 163 | Glendora | 50,926 | 6,069 | 11.92% |
| 164 | San Marcos | 94,882 | 11,055 | 11.65% |
| 165 | Corona | 159,670 | 18,460 | 11.56% |
| 166 | Burbank | 104,546 | 12,021 | 11.5% |
| 167 | Rocklin | 73,327 | 8,314 | 11.34% |
| 168 | Laguna Niguel | 64,139 | 7,241 | 11.29% |
| 169 | El Segundo | 16,769 | 1,891 | 11.28% |
| 170 | Bellflower | 76,819 | 8,652 | 11.26% |
| 171 | Calabasas | 22,669 | 2,552 | 11.26% |
| 172 | Lawndale | 30,781 | 3,424 | 11.12% |
| 173 | Camarillo | 70,186 | 7,801 | 11.11% |
| 174 | Upland | 79,257 | 8,799 | 11.1% |
| 175 | Vacaville | 102,596 | 11,319 | 11.03% |
| 176 | Goleta | 32,685 | 3,573 | 10.93% |
| 177 | Benicia | 26,749 | 2,897 | 10.83% |
| 178 | La Verne | 30,600 | 3,290 | 10.75% |
| 179 | Pomona | 147,943 | 15,678 | 10.6% |
| 180 | Ceres | 49,342 | 5,150 | 10.44% |
| 181 | Temecula | 111,167 | 11,474 | 10.32% |
| 182 | Simi Valley | 125,634 | 12,888 | 10.26% |
| 183 | Lodi | 67,607 | 6,924 | 10.24% |
| 184 | Oroville | 19,752 | 2,014 | 10.2% |
| 185 | Lafayette | 25,285 | 2,552 | 10.09% |
| 186 | Montclair | 37,810 | 3,812 | 10.08% |
| 187 | Santa Monica | 91,169 | 9,141 | 10.03% |
| 188 | Lemon Grove | 27,686 | 2,764 | 9.98% |
| 189 | Martinez | 36,903 | 3,678 | 9.97% |
| 190 | Oakley | 45,183 | 4,458 | 9.87% |
| 191 | Santa Cruz | 61,607 | 6,029 | 9.79% |
| 192 | Fowler | 7,094 | 693 | 9.77% |
| 193 | Ontario | 180,547 | 17,309 | 9.59% |
| 194 | Tiburon | 9,012 | 852 | 9.45% |
| 195 | Merced | 91,953 | 8,681 | 9.44% |
| 196 | Seaside | 31,814 | 3,002 | 9.44% |
| 197 | Gilroy | 59,004 | 5,470 | 9.27% |
| 198 | Highland | 56,675 | 4,932 | 8.7% |
| 199 | Thousand Oaks | 125,205 | 10,890 | 8.7% |
| 200 | Woodland | 61,854 | 5,334 | 8.62% |
| 201 | Murrieta | 112,064 | 9,461 | 8.44% |
| 202 | Mill Valley | 14,012 | 1,165 | 8.31% |
| 203 | Oceanside | 172,242 | 14,188 | 8.24% |
| 204 | Redlands | 73,375 | 6,037 | 8.23% |
| 205 | Fontana | 214,169 | 17,487 | 8.17% |
| 206 | Scotts Valley | 12,044 | 982 | 8.15% |
| 207 | Costa Mesa | 110,330 | 8,954 | 8.12% |
| 208 | Lincoln | 52,956 | 4,249 | 8.02% |
| 209 | Riverside | 319,069 | 25,564 | 8.01% |
| 210 | Carlsbad | 114,373 | 9,123 | 7.98% |
| 211 | Escondido | 149,668 | 11,840 | 7.91% |
| 212 | Bakersfield | 411,986 | 32,043 | 7.78% |
| 213 | Newport Beach | 83,845 | 6,520 | 7.78% |
| 214 | Pacific Grove | 14,951 | 1,161 | 7.77% |
| 215 | Kerman | 16,815 | 1,301 | 7.74% |
| 216 | Westlake Village | 7,743 | 590 | 7.62% |
| 217 | Marysville | 12,726 | 945 | 7.43% |
| 218 | Lake Elsinore | 72,461 | 5,365 | 7.4% |
| 219 | Modesto | 219,215 | 16,079 | 7.33% |
| 220 | Downey | 110,939 | 8,080 | 7.28% |
| 221 | Hawthorne | 85,191 | 6,154 | 7.22% |
| 222 | Hermosa Beach | 19,063 | 1,373 | 7.2% |
| 223 | Santa Fe Springs | 18,871 | 1,351 | 7.16% |
| 224 | Agoura Hills | 19,721 | 1,405 | 7.12% |
| 225 | East Palo Alto | 29,069 | 2,030 | 6.98% |
| 226 | Novato | 52,546 | 3,608 | 6.87% |
| 227 | Beaumont | 56,266 | 3,837 | 6.82% |
| 228 | Corte Madera | 10,077 | 685 | 6.8% |
| 229 | Sausalito | 7,141 | 482 | 6.75% |
| 230 | Moorpark | 35,854 | 2,415 | 6.74% |
| 231 | Larkspur | 12,854 | 859 | 6.68% |
| 232 | Monterey | 29,613 | 1,977 | 6.68% |
| 233 | Atwater | 32,162 | 2,137 | 6.64% |
| 234 | Santee | 59,332 | 3,858 | 6.5% |
| 235 | Woodside | 5,126 | 333 | 6.5% |
| 236 | Rohnert Park | 44,575 | 2,889 | 6.48% |
| 237 | Lemoore | 27,102 | 1,731 | 6.39% |
| 238 | Oxnard | 200,928 | 12,795 | 6.37% |
| 239 | Santa Rosa | 177,090 | 11,103 | 6.27% |
| 240 | Visalia | 143,939 | 8,920 | 6.2% |
| 241 | Chowchilla | 19,020 | 1,166 | 6.13% |
| 242 | Menifee | 110,305 | 6,761 | 6.13% |
| 243 | San Anselmo | 12,679 | 774 | 6.1% |
| 244 | West Hollywood | 34,884 | 2,111 | 6.05% |
| 245 | Half Moon Bay | 11,391 | 685 | 6.01% |
| 246 | Ripon | 16,201 | 958 | 5.91% |
| 247 | La Mesa | 60,797 | 3,579 | 5.89% |
| 248 | Cathedral City | 52,267 | 2,995 | 5.73% |
| 249 | Wildomar | 37,277 | 2,105 | 5.65% |
| 250 | Sebastopol | 7,445 | 416 | 5.59% |
| 251 | Turlock | 72,502 | 4,047 | 5.58% |
| 252 | Vista | 99,114 | 5,528 | 5.58% |
| 253 | South Lake Tahoe | 21,269 | 1,174 | 5.52% |
| 254 | Eureka | 26,010 | 1,432 | 5.51% |
| 255 | Rio Vista | 10,102 | 548 | 5.42% |
| 256 | Salinas | 161,761 | 8,669 | 5.36% |
| 257 | El Cajon | 104,449 | 5,576 | 5.34% |
| 258 | San Luis Obispo | 48,491 | 2,559 | 5.28% |
| 259 | Palm Springs | 45,070 | 2,377 | 5.27% |
| 260 | Chico | 102,188 | 5,323 | 5.21% |
| 261 | Moreno Valley | 211,666 | 10,997 | 5.2% |
| 262 | Whittier | 86,165 | 4,448 | 5.16% |
| 263 | Ojai | 7,577 | 391 | 5.16% |
| 264 | Grand Terrace | 13,078 | 673 | 5.15% |
| 265 | Banning | 31,093 | 1,591 | 5.12% |
| 266 | Solana Beach | 12,823 | 639 | 4.98% |
| 267 | San Buenaventura (Ventura) | 109,857 | 5,424 | 4.94% |
| 268 | San Rafael | 60,433 | 2,980 | 4.93% |
| 269 | Kingsburg | 12,755 | 628 | 4.92% |
| 270 | Patterson | 24,693 | 1,194 | 4.84% |
| 271 | Shasta Lake | 10,311 | 495 | 4.8% |
| 272 | Palm Desert | 51,990 | 2,450 | 4.71% |
| 273 | Palmdale | 164,634 | 7,618 | 4.63% |
| 274 | Imperial Beach | 25,764 | 1,190 | 4.62% |
| 275 | Galt | 25,962 | 1,178 | 4.54% |
| 276 | San Juan Capistrano | 35,095 | 1,572 | 4.48% |
| 277 | Newman | 12,316 | 545 | 4.43% |
| 278 | San Clemente | 63,273 | 2,757 | 4.36% |
| 279 | Riverbank | 25,166 | 1,081 | 4.3% |
| 280 | Encinitas | 61,480 | 2,612 | 4.25% |
| 281 | Santa Maria | 110,462 | 4,651 | 4.21% |
| 282 | Ridgecrest | 28,225 | 1,186 | 4.2% |
| 283 | La Quinta | 38,707 | 1,612 | 4.16% |
| 284 | Lancaster | 169,169 | 6,967 | 4.12% |
| 285 | Hollister | 43,811 | 1,787 | 4.08% |
| 286 | Port Hueneme | 21,582 | 877 | 4.06% |
| 287 | Dixon | 19,683 | 794 | 4.03% |
| 288 | Twentynine Palms | 27,355 | 1,079 | 3.94% |
| 289 | Coalinga | 17,203 | 671 | 3.9% |
| 290 | Laguna Beach | 22,710 | 885 | 3.9% |
| 291 | Hanford | 59,754 | 2,322 | 3.89% |
| 292 | Colton | 53,772 | 2,064 | 3.84% |
| 293 | Redding | 93,409 | 3,531 | 3.78% |
| 294 | Arroyo Grande | 18,372 | 694 | 3.78% |
| 295 | Capitola | 9,689 | 366 | 3.78% |
| 296 | Victorville | 137,627 | 5,189 | 3.77% |
| 297 | Rancho Mirage | 17,563 | 657 | 3.74% |
| 298 | Petaluma | 59,247 | 2,216 | 3.74% |
| 299 | King City | 13,604 | 508 | 3.73% |
| 300 | Sanger | 26,699 | 995 | 3.73% |
| 301 | Paramount | 52,050 | 1,903 | 3.66% |
| 302 | Lompoc | 43,646 | 1,588 | 3.64% |
| 303 | Norco | 25,054 | 902 | 3.6% |
| 304 | San Bernardino | 222,724 | 7,968 | 3.58% |
| 305 | Selma | 24,659 | 879 | 3.56% |
| 306 | Santa Barbara | 87,779 | 3,109 | 3.54% |
| 307 | Citrus Heights | 86,995 | 3,069 | 3.53% |
| 308 | Perris | 80,511 | 2,824 | 3.51% |
| 309 | Exeter | 10,258 | 359 | 3.5% |
| 310 | Loomis | 6,853 | 236 | 3.44% |
| 311 | Pico Rivera | 60,272 | 2,059 | 3.42% |
| 312 | Hemet | 91,326 | 3,114 | 3.41% |
| 313 | Tulare | 70,945 | 2,406 | 3.39% |
| 314 | Apple Valley | 75,473 | 2,556 | 3.39% |
| 315 | Coronado | 19,015 | 635 | 3.34% |
| 316 | Fairfax | 7,516 | 243 | 3.23% |
| 317 | Yucaipa | 54,421 | 1,733 | 3.18% |
| 318 | Canyon Lake | 11,119 | 349 | 3.14% |
| 319 | Waterford | 9,204 | 277 | 3.01% |
| 320 | Pismo Beach | 8,014 | 241 | 3.01% |
| 321 | Napa | 78,239 | 2,338 | 2.99% |
| 322 | Porterville | 63,157 | 1,882 | 2.98% |
| 323 | Anderson | 11,255 | 332 | 2.95% |
| 324 | Soledad | 26,365 | 776 | 2.94% |
| 325 | Corning | 8,155 | 240 | 2.94% |
| 326 | Grover Beach | 12,604 | 370 | 2.94% |
| 327 | Willows | 6,190 | 181 | 2.92% |
| 328 | Solvang | 6,034 | 176 | 2.92% |
| 329 | Dana Point | 32,790 | 954 | 2.91% |
| 330 | El Paso De Robles (Paso Robles) | 31,446 | 914 | 2.91% |
| 331 | Malibu | 10,421 | 302 | 2.9% |
| 332 | Barstow | 25,100 | 725 | 2.89% |
| 333 | Imperial | 21,430 | 618 | 2.88% |
| 334 | Susanville | 14,177 | 405 | 2.86% |
| 335 | Fortuna | 12,326 | 348 | 2.82% |
| 336 | Cotati | 7,489 | 211 | 2.82% |
| 337 | Ukiah | 16,304 | 456 | 2.8% |
| 338 | Morro Bay | 10,692 | 298 | 2.79% |
| 339 | Mammoth Lakes | 7,214 | 200 | 2.77% |
| 340 | San Jacinto | 55,180 | 1,499 | 2.72% |
| 341 | Indio | 91,950 | 2,421 | 2.63% |
| 342 | Los Banos | 47,593 | 1,249 | 2.62% |
| 343 | Big Bear Lake | 5,041 | 132 | 2.62% |
| 344 | Shafter | 21,193 | 524 | 2.47% |
| 345 | Watsonville | 51,712 | 1,273 | 2.46% |
| 346 | Inglewood | 104,569 | 2,482 | 2.37% |
| 347 | Rialto | 104,143 | 2,294 | 2.2% |
| 348 | Truckee | 17,066 | 365 | 2.14% |
| 349 | Atascadero | 29,712 | 610 | 2.05% |
| 350 | Auburn | 13,768 | 278 | 2.02% |
| 351 | Carpinteria | 13,036 | 258 | 1.98% |
| 352 | California City | 14,414 | 282 | 1.96% |
| 353 | Sonoma | 10,670 | 203 | 1.9% |
| 354 | San Fernando | 23,632 | 448 | 1.9% |
| 355 | Healdsburg | 11,243 | 213 | 1.89% |
| 356 | Fort Bragg | 7,032 | 133 | 1.89% |
| 357 | Yucca Valley | 21,770 | 408 | 1.87% |
| 358 | Brawley | 27,283 | 511 | 1.87% |
| 359 | Gustine | 6,133 | 109 | 1.78% |
| 360 | St. Helena | 5,318 | 93 | 1.75% |
| 361 | Orland | 8,357 | 146 | 1.75% |
| 362 | Windsor | 26,081 | 450 | 1.73% |
| 363 | Tehachapi | 11,946 | 201 | 1.68% |
| 364 | Calistoga | 5,111 | 85 | 1.66% |
| 365 | Guadalupe | 8,566 | 136 | 1.59% |
| 366 | Reedley | 25,609 | 405 | 1.58% |
| 367 | Red Bluff | 14,549 | 226 | 1.55% |
| 368 | Adelanto | 37,964 | 577 | 1.52% |
| 369 | Hesperia | 100,775 | 1,519 | 1.51% |
| 370 | Blythe | 17,396 | 260 | 1.49% |
| 371 | Paradise | 7,392 | 105 | 1.42% |
| 372 | Ione | 9,156 | 130 | 1.42% |
| 373 | Desert Hot Springs | 33,200 | 463 | 1.39% |
| 374 | Colusa | 6,505 | 90 | 1.38% |
| 375 | Crescent City | 6,046 | 82 | 1.36% |
| 376 | Dinuba | 25,475 | 337 | 1.32% |
| 377 | Santa Paula | 31,376 | 410 | 1.31% |
| 378 | Madera | 67,831 | 885 | 1.3% |
| 379 | Corcoran | 22,491 | 278 | 1.24% |
| 380 | Clearlake | 16,659 | 202 | 1.21% |
| 381 | Gridley | 7,330 | 87 | 1.19% |
| 382 | Oakdale | 23,194 | 274 | 1.18% |
| 383 | Compton | 92,698 | 1,061 | 1.14% |
| 384 | Fillmore | 16,816 | 186 | 1.11% |
| 385 | Arcata | 18,607 | 204 | 1.1% |
| 386 | Grass Valley | 14,113 | 151 | 1.07% |
| 387 | Placerville | 10,762 | 112 | 1.04% |
| 388 | Lindsay | 12,643 | 129 | 1.02% |
| 389 | Calexico | 38,585 | 392 | 1.02% |
| 390 | Bell | 32,476 | 326 | 1.0% |
| 391 | El Centro | 44,240 | 430 | 0.97% |
| 392 | Avenal | 13,608 | 131 | 0.96% |
| 393 | South Gate | 91,483 | 839 | 0.92% |
| 394 | Calimesa | 10,902 | 99 | 0.91% |
| 395 | Winters | 7,583 | 68 | 0.9% |
| 396 | Commerce | 11,993 | 101 | 0.84% |
| 397 | Greenfield | 20,232 | 155 | 0.77% |
| 398 | Holtville | 5,617 | 43 | 0.77% |
| 399 | Lynwood | 64,578 | 473 | 0.73% |
| 400 | Cloverdale | 8,886 | 60 | 0.68% |
| 401 | Mcfarland | 14,222 | 93 | 0.65% |
| 402 | Orange Cove | 9,695 | 56 | 0.58% |
| 403 | Maywood | 24,317 | 135 | 0.56% |
| 404 | Bell Gardens | 38,229 | 212 | 0.55% |
| 405 | Huntington Park | 53,108 | 288 | 0.54% |
| 406 | Wasco | 26,558 | 143 | 0.54% |
| 407 | Escalon | 7,451 | 35 | 0.47% |
| 408 | Woodlake | 7,702 | 35 | 0.45% |
| 409 | Yreka | 7,820 | 25 | 0.32% |
| 410 | Taft | 7,125 | 21 | 0.29% |
| 411 | Parlier | 14,507 | 42 | 0.29% |
| 412 | Mendota | 12,577 | 36 | 0.29% |
| 413 | Hughson | 7,648 | 17 | 0.22% |
| 414 | Gonzales | 8,492 | 16 | 0.19% |
| 415 | Calipatria | 6,548 | 12 | 0.18% |
| 416 | Firebaugh | 8,392 | 14 | 0.17% |
| 417 | Coachella | 43,307 | 69 | 0.16% |
| 418 | Farmersville | 10,397 | 15 | 0.14% |
| 419 | Cudahy | 22,087 | 26 | 0.12% |
| 420 | Arvin | 19,539 | 18 | 0.09% |
| 421 | Huron | 6,519 | 0 | 0.0% |