Behind the beautiful beaches, hip cities, and outrageous food, there are certain places in California that are safer than others.
But how exactly is one to tell where the safest places are to live in the Golden State?
Well, data, of course.
And that's where we come in -- we've broken down the safest cities in California based on the most recent FBI data. And at this point, we're quite the experts on ranking safe towns; it's the eleventh time we've ranked the safest places in California.
From Los Angeles to San Francisco suburbs, California has much to offer if you're looking for a safe place to put down roots with a family. It's just checking general safety trends before picking a place to live.
Because California is the most populous state in the U.S., narrowing down the safest cities in the Golden State was quite the job. Let's take a look.
36 violent / 379 property per 100k
Data | Crime | Cost of living | Movers
49 violent / 358 property per 100k
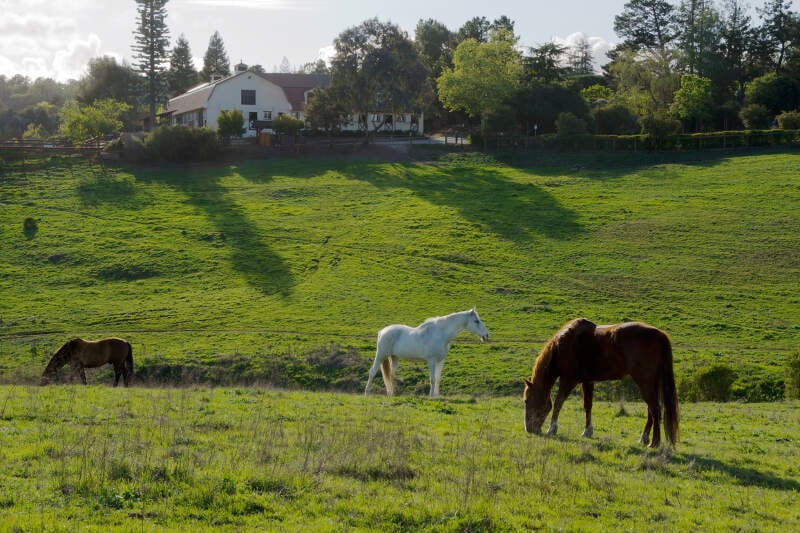
Los Altos Hills is an incorporated town in Santa Clara County, California, United States. The Los Altos Hills ZIP code 94022 appeared on the 2017 Forbes list of America's most expensive ZIP codes; 94022 was ranked the 3rd most expensive in the United States, with a median home price of $7,755,000.
And now it can add its most prestigious award yet -- HomeSnacks second safest city in California for 2026.
Can't beat that.
It ranks seventh safest in the state for violent crime and sixth safest for property crime.
Data | Crime | Cost of living | Movers

66 violent / 233 property per 100k
Data | Cost of living | Movers
77 violent / 182 property per 100k
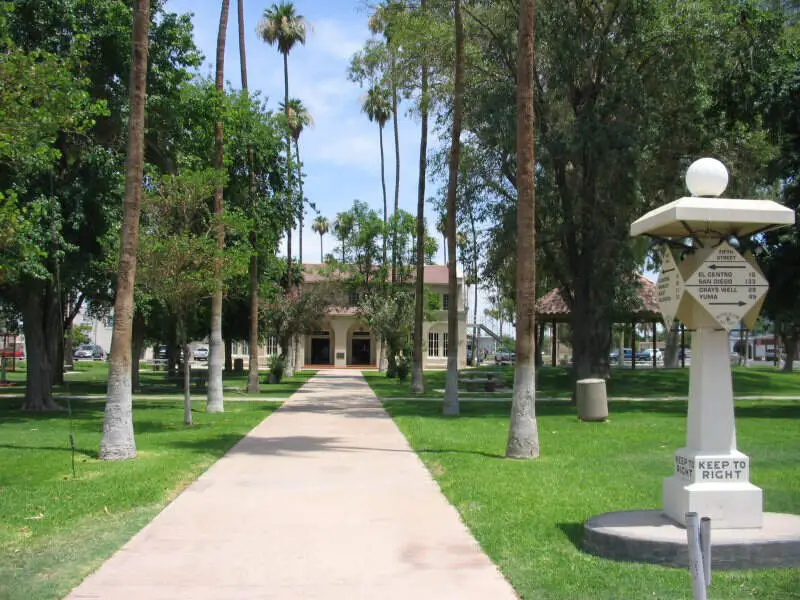
The second best place when it comes to property crime in California goes to Imperial.
Imperial rides that to an overall #1 ranking again this year.
Imperial is a city in Imperial County, California. Imperial is located 4 miles north of El Centro. This region is well known for its abundance of bird species such as dove, quail, ducks, pheasant and geese.
Data | Crime | Cost of living | Movers
63 violent / 584 property per 100k
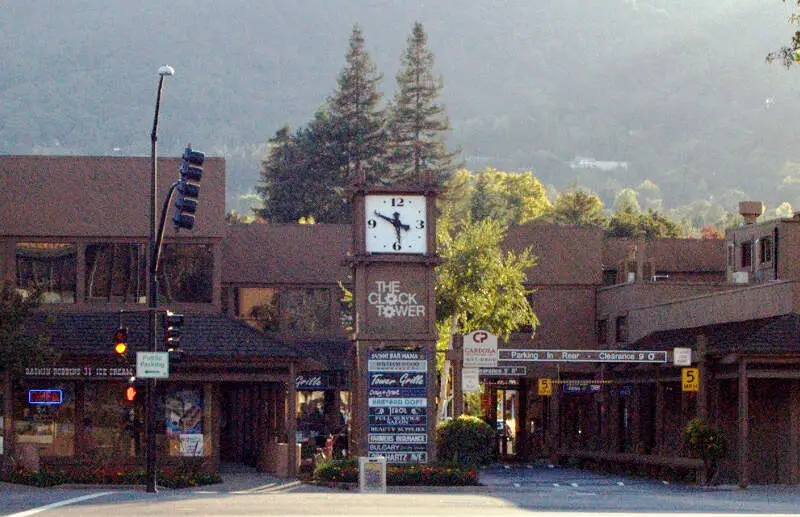
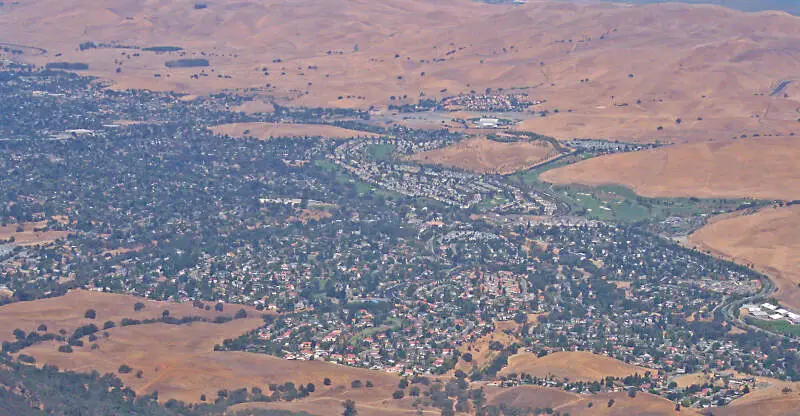
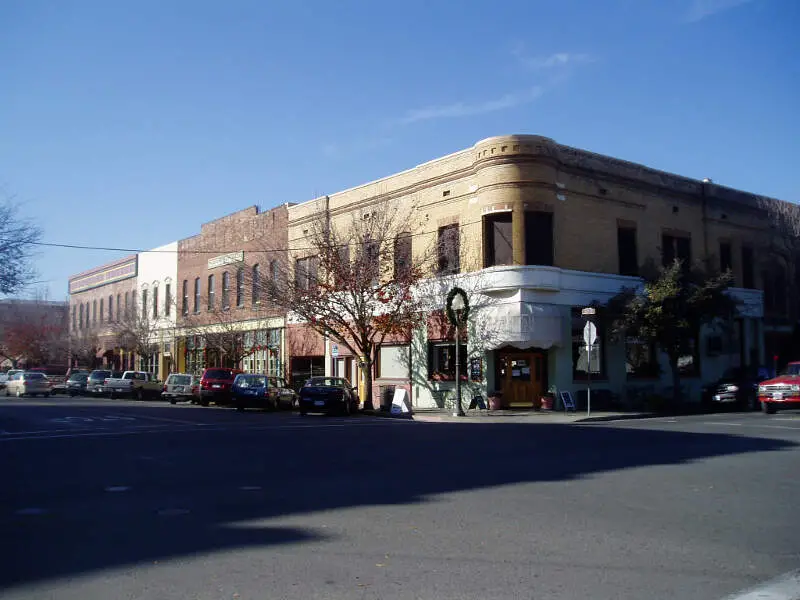
The Town of Danville is located in the San Ramon Valley in Contra Costa County and ranks as the fifth safest city for 2026 in CA.
A top ten ranking for violent crime per capita helped it earn this distinction.
And look at the mall in that picture -- doesn't it just ooze safety?
Data | Crime | Cost of living | Movers
81 violent / 524 property per 100k
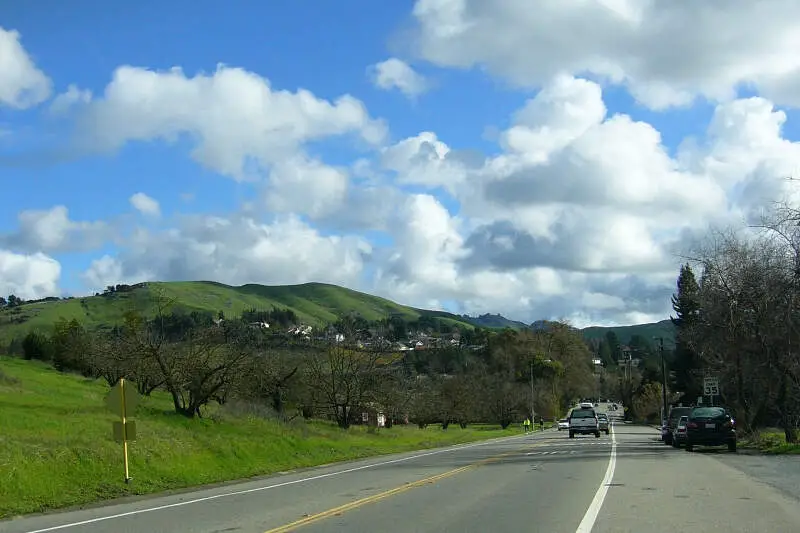
Grab the tequila as we take our next stop of our safe road trip in Rancho Santa Margarita -- the sixth safest city in California this year.
Besides being the city with the most letters in it, Rancho Santa Margarita has very few property crimes for a city of its size. It also offer affordable living for California and plenty to do for the whole family.
And in case you actually thought it was named for the drink, it is named for Rancho Santa Margarita y Las Flores.
Data | Crime | Cost of living | Movers
84 violent / 507 property per 100k
Data | Crime | Cost of living | Movers
91 violent / 487 property per 100k
Moraga is the eighth safest place in the Golden State and second city so far to hit a 10 on our SnackAbility Score -- an honor only 5% of over 6,000 cities in America achieve.
Moraga is a suburban incorporated town located in Contra Costa County, California. It's about as safe for property and violent crime.
Data | Crime | Cost of living | Movers
91 violent / 491 property per 100k
Data | Crime | Cost of living | Movers
89 violent / 534 property per 100k
Data | Crime | Cost of living | Movers
The receipts
Compare the top ten
Pick a metric. The bars rescale. The red line is California's statewide median. Lower is safer.
California statewide median: 331
California statewide median: 1,591
California statewide median: 1
On the map
Where the safety is in California
Saturday Night Science
Methodology: How we calculated the safest cities in California for 2026
While there are surveys and public polls on what cities in California are the safest, we wanted to rely on something other than speculation and opinion. Instead, we looked at the hard numbers from the FBI's most recent crime report in California.
Specifically, we used Saturday Night Science to analyze the FBI's Uniform Crime Report, which summarizes the number of property and violent crimes in each city annually. We used two criteria:
- Violent crimes per capita (murders, assaults, rapes, armed robberies)
- Property crimes per capita (thefts, burglaries, motor vehicle thefts)
For example, there were 23 crimes committed in Holtville, with a reported population of 5,541. That means the number of crimes per capita is 0.0042, which translates into a 1 in 240 chance of being the victim of a crime.
We only looked at California cities that have populations of more than 5,000. This filter left us with 416 of the biggest cities in California to rank.
We ranked each city for each criterion from 1 to 416 where 1 in any particular category is the safest.
Next, we averaged each place's two criteria to create a Safety Index. We crowned the place with the lowest overall Safety Score, "The Safest Place In California," with any ties going to the bigger city.
The safest city in California, based on our criteria, is Holtville. The most dangerous city in California? Commerce, where residents had a 1 in 7 chance of being the victim of a crime.
This article has been update for 2026. This report marks our eleventh time ranking the safest places to live in California. All the data comes from the FBI's Crime In The USA 2024 report.
Summary
Summary: The Safest Cities In The Golden State
Looking at the data, you can tell that Holtville is as safe as they come in California, according to science and data.
But as most California residents would agree, almost every place here has its safe and not safe parts. So just make sure you're informed ahead of time.
The safest places in California are .
For more reading, check out:
The full plate
Where Are The Safest Cities In California For 2026?
Click any column to sort. All 416 ranked California cities.
| Rank | City | Population | Violent / 100k | Property / 100k | Murders / 100k | Murders |
|---|---|---|---|---|---|---|
| 1 | Holtville, CA | 5,541 | 36 | 378 | 0 | 0 |
| 2 | Los Altos Hills, CA | 8,092 | 49 | 358 | 0 | 0 |
| 3 | Calipatria, CA | 6,020 | 66 | 232 | 0 | 0 |
| 4 | Imperial, CA | 21,980 | 77 | 181 | 0 | 0 |
| 5 | Danville, CA | 42,814 | 63 | 583 | 0 | 0 |
| 6 | Rancho Santa Margarita, CA | 45,633 | 81 | 523 | 0 | 0 |
| 7 | Clayton, CA | 10,655 | 84 | 506 | 0 | 0 |
| 8 | Moraga, CA | 16,438 | 91 | 486 | 6 | 1 |
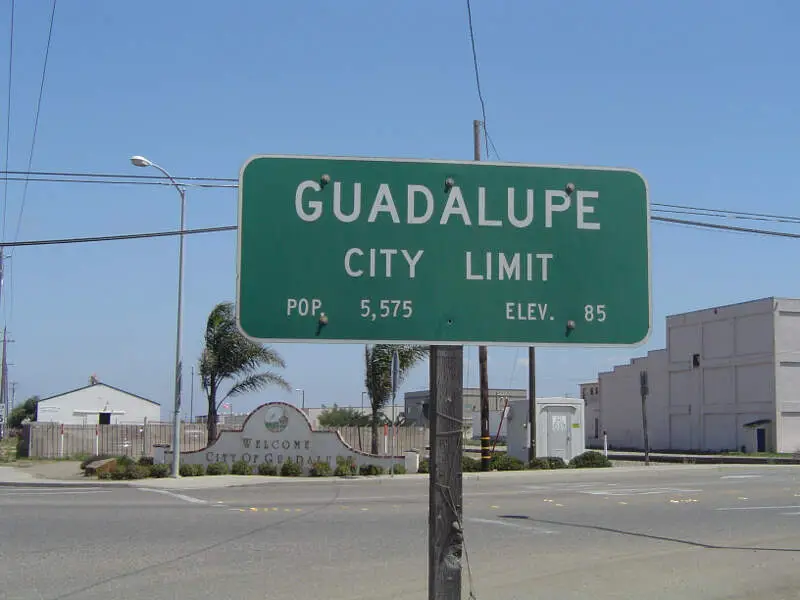
| 9 | Guadalupe, CA | 8,762 | 91 | 490 | 0 | 0 |
| 10 | Winters, CA | 7,869 | 88 | 533 | 0 | 0 |
| 11 | Villa Park, CA | 5,611 | 35 | 712 | 0 | 0 |
| 12 | Foster City, CA | 31,680 | 69 | 669 | 0 | 0 |
| 13 | Canyon Lake, CA | 11,100 | 45 | 756 | 0 | 0 |
| 14 | Saratoga, CA | 29,185 | 89 | 599 | 0 | 0 |
| 15 | Palos Verdes Estates, CA | 12,432 | 24 | 788 | 0 | 0 |
| 16 | Lincoln, CA | 56,152 | 96 | 560 | 1 | 1 |
| 17 | Newman, CA | 12,146 | 115 | 428 | 0 | 0 |
| 18 | Hillsborough, CA | 10,728 | 93 | 680 | 0 | 0 |
| 19 | Orinda, CA | 19,314 | 56 | 880 | 5 | 1 |
| 20 | Bear Valley, CA | 5,467 | 164 | 256 | 0 | 0 |
| 21 | Moorpark, CA | 35,312 | 99 | 713 | 0 | 0 |
| 22 | Yorba Linda, CA | 65,469 | 93 | 765 | 0 | 0 |
| 23 | Poway, CA | 47,808 | 133 | 583 | 0 | 0 |
| 24 | Laguna Woods, CA | 16,797 | 59 | 893 | 0 | 0 |
| 25 | Calexico, CA | 38,106 | 146 | 535 | 0 | 0 |
| 26 | Hughson, CA | 7,747 | 167 | 413 | 0 | 0 |
| 27 | Solvang, CA | 5,923 | 67 | 928 | 0 | 0 |
| 28 | Rancho Palos Verdes, CA | 39,289 | 91 | 883 | 0 | 0 |
| 29 | Hercules, CA | 26,739 | 168 | 673 | 0 | 0 |
| 30 | Lake Forest, CA | 85,811 | 145 | 829 | 0 | 0 |
| 31 | Tiburon, CA | 8,751 | 45 | 1,119 | 0 | 0 |
| 32 | Aliso Viejo, CA | 49,674 | 134 | 867 | 0 | 0 |
| 33 | La Habra Heights, CA | 5,273 | 170 | 682 | 0 | 0 |
| 34 | Agoura Hills, CA | 19,229 | 124 | 894 | 0 | 0 |
| 35 | Laguna Niguel, CA | 62,363 | 126 | 904 | 0 | 0 |
| 36 | Mill Valley, CA | 13,658 | 95 | 1,003 | 0 | 0 |
| 37 | San Marino, CA | 11,816 | 33 | 1,176 | 0 | 0 |
| 38 | Fairfax, CA | 7,362 | 108 | 964 | 0 | 0 |
| 39 | St. Helena, CA | 5,224 | 172 | 746 | 0 | 0 |
| 40 | Simi Valley, CA | 124,707 | 129 | 923 | 2 | 3 |
| 41 | San Ramon, CA | 84,452 | 86 | 1,113 | 0 | 0 |
| 42 | Thousand Oaks, CA | 122,363 | 102 | 1,020 | 2 | 3 |
| 43 | Wildomar, CA | 37,145 | 102 | 1,020 | 2 | 1 |
| 44 | Pacific Grove, CA | 14,649 | 143 | 907 | 0 | 0 |
| 45 | Fillmore, CA | 17,428 | 189 | 665 | 0 | 0 |
| 46 | Sierra Madre, CA | 10,544 | 208 | 597 | 0 | 0 |
| 47 | Ripon, CA | 16,053 | 168 | 865 | 0 | 0 |
| 48 | Menifee, CA | 117,055 | 182 | 798 | 0 | 1 |
| 49 | Chino Hills, CA | 76,802 | 138 | 975 | 0 | 0 |
| 50 | Rocklin, CA | 74,048 | 164 | 903 | 1 | 1 |
| 51 | Oakley, CA | 46,548 | 146 | 966 | 0 | 0 |
| 52 | Rio Vista, CA | 10,191 | 245 | 382 | 9 | 1 |
| 53 | Los Altos, CA | 29,551 | 77 | 1,211 | 0 | 0 |
| 54 | Benicia, CA | 26,207 | 133 | 1,030 | 0 | 0 |
| 55 | Arroyo Grande, CA | 18,179 | 198 | 753 | 11 | 2 |
| 56 | San Marcos, CA | 93,974 | 222 | 659 | 1 | 1 |
| 57 | Laguna Beach, CA | 22,115 | 167 | 949 | 0 | 0 |
| 58 | Waterford, CA | 9,387 | 181 | 884 | 0 | 0 |
| 59 | Solana Beach, CA | 12,592 | 103 | 1,167 | 0 | 0 |
| 60 | Mission Viejo, CA | 89,699 | 99 | 1,186 | 0 | 0 |
| 61 | Lafayette, CA | 24,934 | 80 | 1,267 | 0 | 0 |
| 62 | Dana Point, CA | 32,405 | 185 | 873 | 0 | 0 |
| 63 | Soledad, CA | 23,708 | 257 | 527 | 0 | 0 |
| 64 | Santee, CA | 59,351 | 254 | 571 | 3 | 2 |
| 65 | Windsor, CA | 25,660 | 233 | 732 | 0 | 0 |
| 66 | San Juan Capistrano, CA | 34,620 | 164 | 1,077 | 5 | 2 |
| 67 | Atascadero, CA | 29,685 | 178 | 970 | 3 | 1 |
| 68 | Murrieta, CA | 112,125 | 183 | 943 | 0 | 1 |
| 69 | Camarillo, CA | 69,115 | 128 | 1,190 | 1 | 1 |
| 70 | Kensington, CA | 5,398 | 111 | 1,241 | 0 | 0 |
| 71 | Ione, CA | 5,531 | 289 | 415 | 0 | 0 |
| 72 | Irvine, CA | 316,764 | 83 | 1,389 | 1 | 5 |
| 73 | Firebaugh, CA | 8,698 | 229 | 850 | 0 | 0 |
| 74 | Atherton, CA | 6,711 | 104 | 1,281 | 0 | 0 |
| 75 | Orange Cove, CA | 9,448 | 306 | 306 | 0 | 0 |
| 76 | Santa Clarita, CA | 221,303 | 165 | 1,176 | 0 | 2 |
| 77 | Encinitas, CA | 60,461 | 215 | 941 | 1 | 1 |
| 78 | Ojai, CA | 7,412 | 269 | 769 | 0 | 0 |
| 79 | Beaumont, CA | 60,294 | 204 | 1,018 | 0 | 0 |
| 80 | Sonoma, CA | 10,583 | 179 | 1,152 | 0 | 0 |
| 81 | Cotati, CA | 7,377 | 203 | 1,043 | 0 | 0 |
| 82 | Pacifica, CA | 35,759 | 145 | 1,305 | 0 | 0 |
| 83 | Paradise, CA | 9,809 | 285 | 693 | 10 | 1 |
| 84 | King City, CA | 14,112 | 290 | 687 | 0 | 0 |
| 85 | La Canada Flintridge, CA | 19,229 | 88 | 1,518 | 0 | 0 |
| 86 | Gustine, CA | 6,086 | 230 | 969 | 0 | 0 |
| 87 | Belmont, CA | 26,099 | 164 | 1,283 | 3 | 1 |
| 88 | Calabasas, CA | 21,897 | 159 | 1,306 | 0 | 0 |
| 89 | Temple City, CA | 34,359 | 221 | 1,053 | 11 | 4 |
| 90 | Morro Bay, CA | 10,532 | 294 | 788 | 0 | 0 |
| 91 | Kingsburg, CA | 13,218 | 166 | 1,331 | 0 | 0 |
| 92 | Orland, CA | 8,068 | 285 | 867 | 0 | 0 |
| 93 | Rolling Hills Estates, CA | 7,958 | 100 | 1,545 | 0 | 0 |
| 94 | Los Gatos, CA | 31,828 | 147 | 1,432 | 0 | 0 |
| 95 | San Clemente, CA | 61,692 | 183 | 1,267 | 1 | 1 |
| 96 | Elk Grove, CA | 179,074 | 189 | 1,231 | 1 | 3 |
| 97 | Patterson, CA | 25,491 | 274 | 957 | 0 | 0 |
| 98 | Cupertino, CA | 56,375 | 111 | 1,566 | 0 | 0 |
| 99 | Laguna Hills, CA | 29,895 | 234 | 1,130 | 0 | 0 |
| 100 | Sausalito, CA | 6,945 | 71 | 1,742 | 0 | 0 |
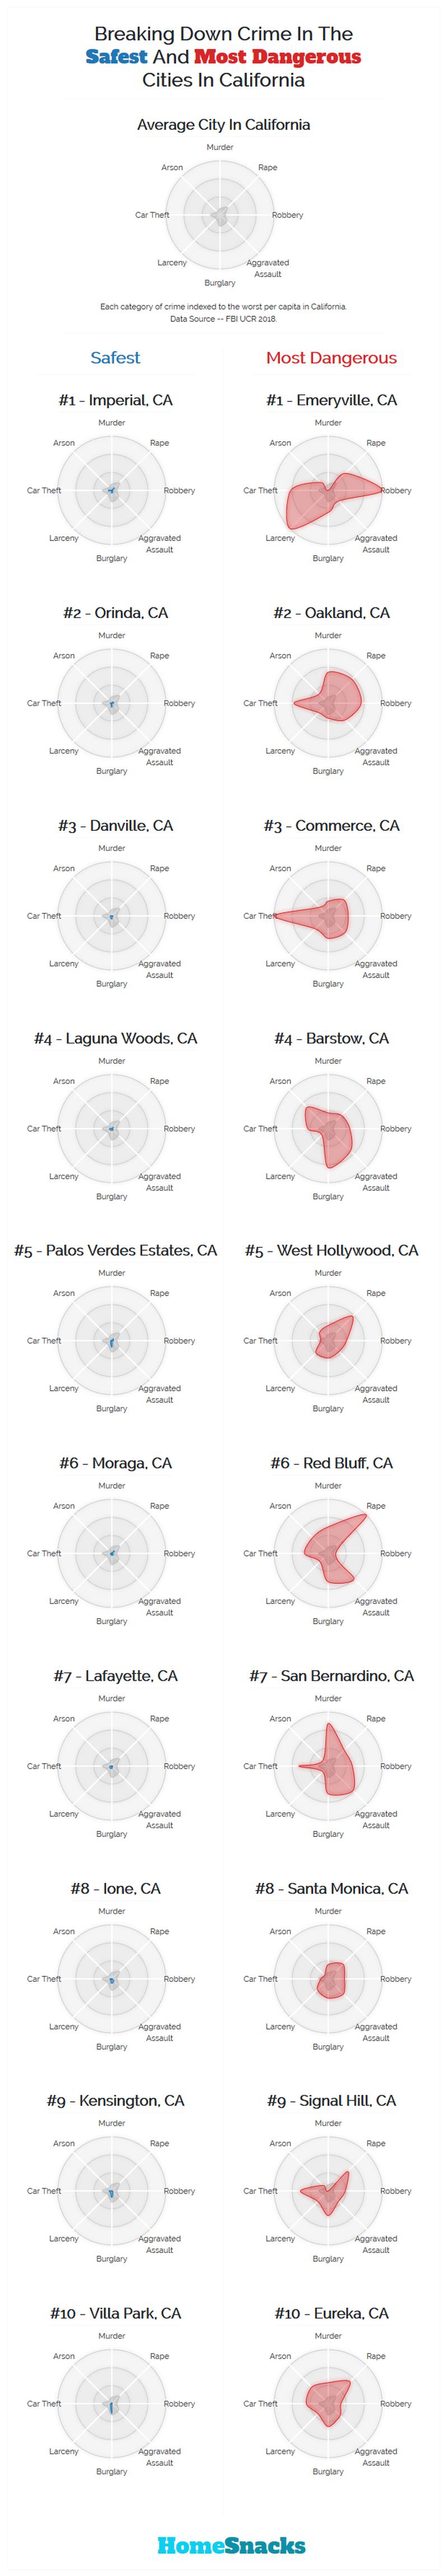
Breaking Down Crime In The Safest And Most Dangerous Cities In California
Keep exploring